After another failed drift higher on weak momentum we are seeing S&P 500 futures head lower this morning. That said, they are bouncing off an important support level near 2036. Buyers have had the habit of showing up at important support and today is no different for now.
S&P 500 futures support for April 5 is between 2030.5 and 2036.5, and below that we have the 2022.5-2027 levels. Resistance sits between 2071.5 and 2076. If buyers catch a bid up here we could stretch all the way to 2087.5; but that seems unlikely at this writing.
Momentum on the four hour chart is neutral to bearish – BUT sitting at important support, luring buyers back into the game. Their show of force will be watched – buyers have been beaten down off recent highs quite a bit and they could get tired on this bounce up.
Shorter time frame momentum indicators are negative, but flattening at these support zones. This selloff from Friday’s high is now a bit steep, suggesting that buyers really need to exercise effort to keep pressure on the sellers here.
See today’s economic calendar with a rundown of releases.
THE RANGE OF THURSDAY’S MOTION
Crude Oil Futures (CL_F)
Note that the API report is this afternoon. A support test of 35.3 sees lifting price off critical support level across several time frames. This was my thought progression yesterday – that crude oil prices would come into the 35.34 region, and we did just that. Today we could find sellers waiting at 35.89 and 36.20 before we reverse to retest support levels.
Today, the trading ranges for crude oil futures are between 34.64 and 36.6, caught between moving averages on higher time frames.
Moving averages in oil are negative on tighter time frames, but we are bouncing off a support level of importance. Resistance is now lower between 38.2 and 37.7; deeper support is likely near 35.14 and 34.7.
Intraday long trading setups for crude oil suggest a long off a 35.4 positive retest (check momentum here), or 35.78 positive retest on the pullback into targets of 36.12, 36.46, 36.74, 37.24, 37.42, 37.7, and if buyers hold on, we’ll see 38.31.
Intraday short trading setups suggest a short below a 35.7 failed retest with negative divergence, or the failed retest of 36.12 sends us back through targets at 35.89, 35.76, 35.45, 35.14, and 34.89 to 34.7, if sellers hang on.
Have a look at the Fibonacci levels marked in the blog for more targets.
E-mini S&P 500 Futures (ES_F)
Below is a S&P 500 futures chart with price support and resistance trading levels for today. Click to enlarge.
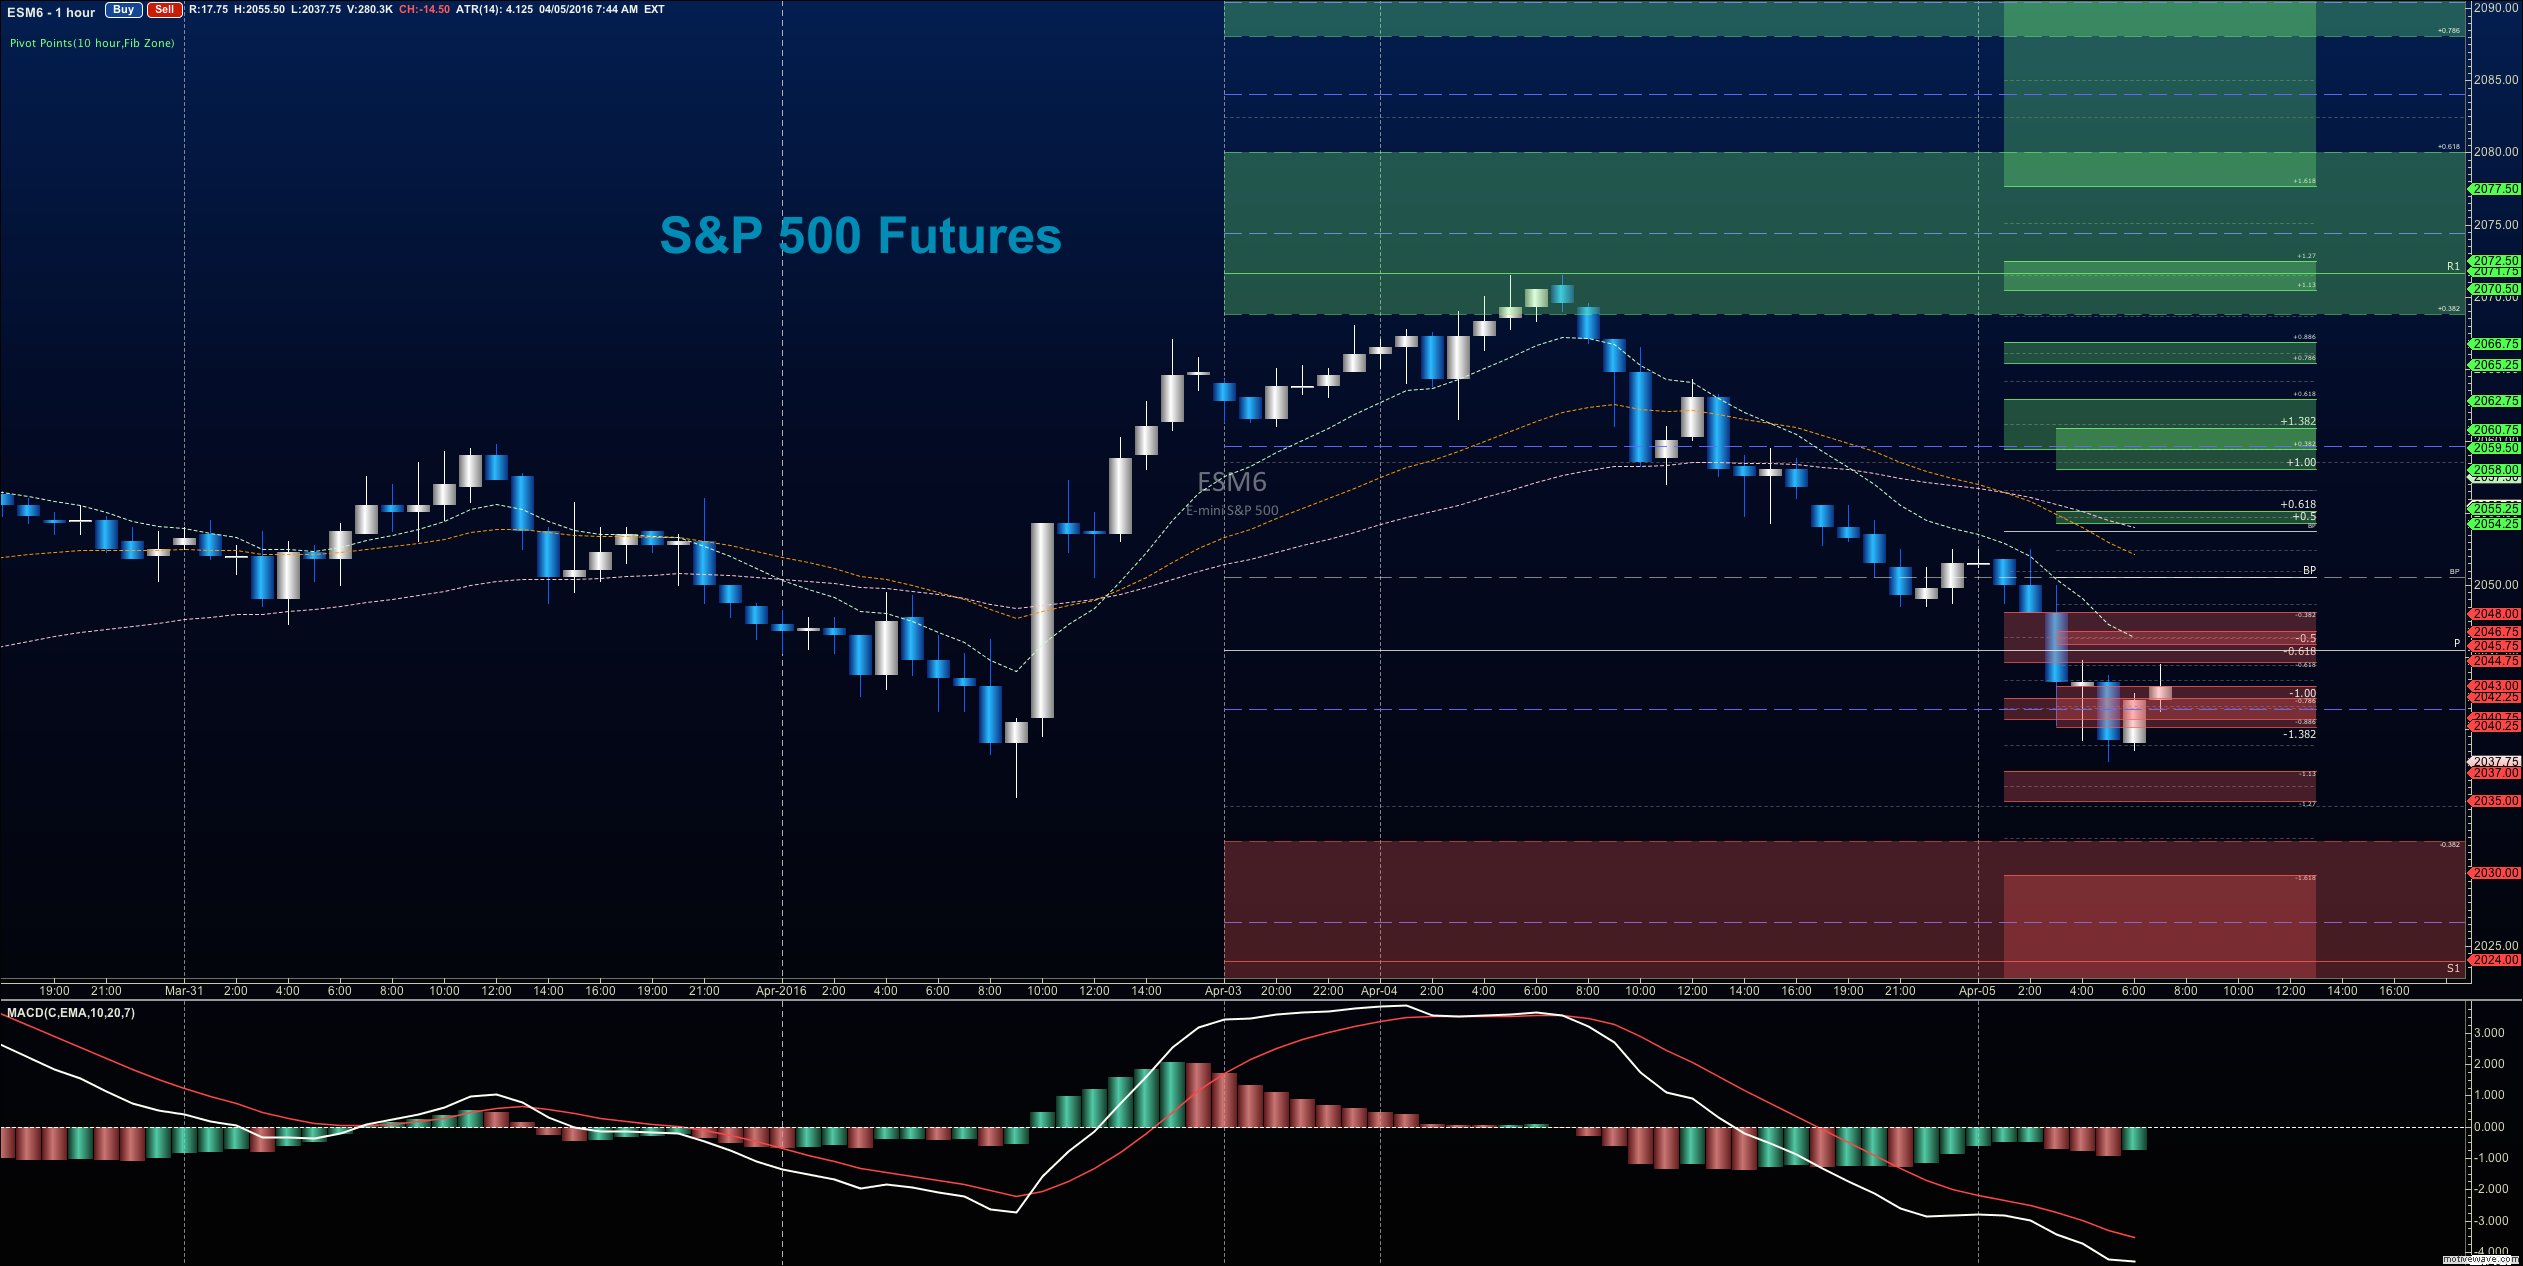
The levels between 2071.5- 2075.25 still serve as front line resistance on S&P 500 futures charts. But support has drifted lower into 2030.5- 2036.5 for today (April 5)… so watch that area. Stretches north could see 2087.75 –but again, that seems unlikely.
Upside motion on S&P 500 futures has the best setup on the positive retest of 2037.75 or a breach and retest of 2044.5 with positive momentum. I use the 30min to 1hr chart for the breach and retest mechanic. Targets from 2042.5 are 2044.5, 2047.5, 2049.75, 2051.25, 2054.5, 2057.5, and if we can catch a bid there, we could expand into 2061.5, 2064.25, and 2067.5. Longs are still trending over the bigger picture for now, but momentum remains damp. The rise up has been extremely steep and looks somewhat unsustainable without a pullback.
Downside motion opens below the failed retest of 2042 or at the failed retest of 2055.5 with negative divergence (careful here). Retracement into lower levels from 2055.5 gives us the targets 2051.25, 2049.75, 2044.75, 2040.50, 2037.75, 2035.75, 2032.75, 2029.5, and perhaps 2025.5 to 2022.5, if selling really takes hold.
Have a look at the Fibonacci levels marked in the blog for more targets.
If you’re interested in the live trading room, it is now primarily stock market futures content, though we do track heavily traded stocks and their likely daily trajectories as well – we begin at 9am with a morning report and likely chart movements along with trade setups for the day.
As long as traders remain aware of support and resistance levels, risk can be very adequately managed to play in either direction as bottom picking remains a behavior pattern that is developing with value buyers and speculative traders.
Thanks for reading.
Twitter: @AnneMarieTrades
The author trades stock market futures every day and may have a position in mentioned securities at the time of publication. Any opinions expressed herein are solely those of the author, and do not in any way represent the views or opinions of any other person or entity.


