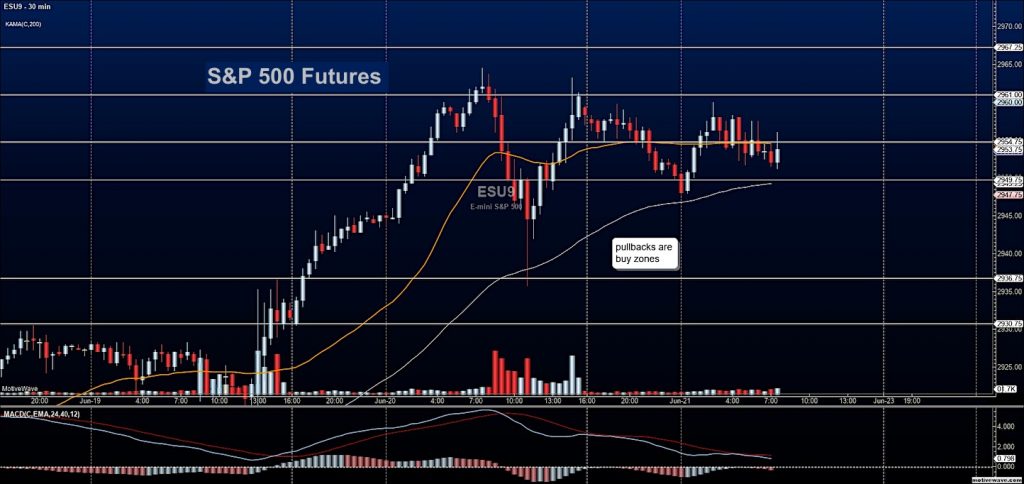
S&P 500 Futures Intraday Trading Chart – June 21
The breakout level of 2923 on S&P 500 futures seems so far away. The major US stock market futures index is bullish but significant dislocation exists.
Why? Look no further than yesterday’s asset class performance – they were ALL up.
Pullbacks are buy zones today but market assets will eventually recalibrate. Pairs trading folks are likely having a particularly tough time of it.
THE BIG PICTURE – Daily stock market momentum has shifted positive and now with the breach and hold of 2948 keeps us in breakout territory. Under the current bullish momentum, fades will send us right into the next group of buyers. I still do not advocate buying breakouts but at support zones
INTRADAY RECAP – Break to the upside holds but the ES_F is inside yesterday’s initial balance (the first hour of US trading). Traders are still holding gold into new highs but giving back a bit. The USD is at critical support. Losing this region delivers higher probabilities that we head to 96.
Sellers want to move the S&P 500 to move below 2946 intraday. Pullbacks into higher lows will be buy zones intraday and traders have a bullish slant overall.
Twitter: @AnneMarieTrades
The author trades stock market futures every day and may have a position in mentioned securities at the time of publication. Any opinions expressed herein are solely those of the author, and do not in any way represent the views or opinions of any other person or entity.


 Ready To Break Out?")
 Rolling Over At Key Fibonacci Level?")
