Broad Stock Market Futures Trading Outlook for July 5, 2018
Neutral trading action from longer time frames hold the traders here as much remains in the areas of decisions. We spike to resistance and fade. We collapse into support and rise.
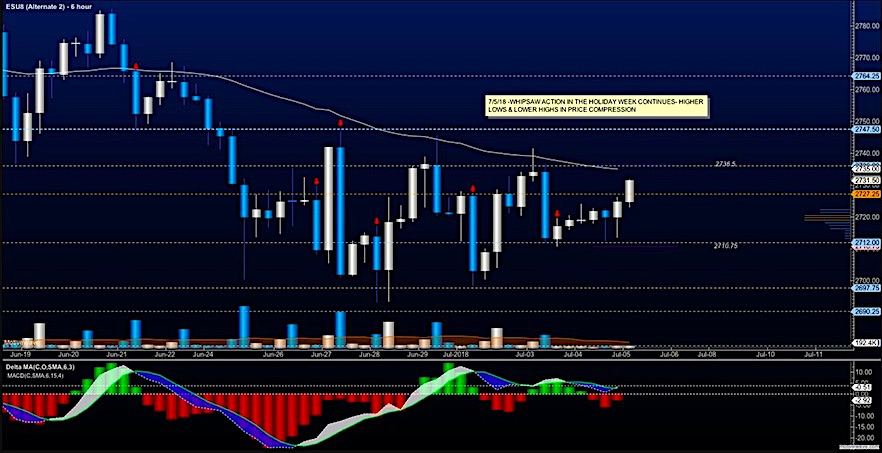
This morning we sit at resistance with another fade likely. A failure to breach higher combined with a test of deeper support will identify a reversal zone but price ranges have also been compressing in the holiday week which will surely give us light volume today and tomorrow as well.
S&P 500 Futures
Bounces are presently holding under the thin volume landscape-redux.
Buyers hold us above the key level of 2727 in a rise off the higher lows of Tuesday. Neutral momentum reading and compressing ranges might make today a bit difficult to trade. The bullets below represent the likely shift of trading momentum at the successful or failed retests at the levels noted.
- Buying pressure intraday will likely strengthen with a bullish retest of 2736.75
- Selling pressure intraday will likely strengthen with a bearish retest of 2717.75
- Resistance sits near 2734.5 to 2741.5, with 2747.75 and 2753.75 above that.
- Support sits between 2722.5 and 2715.5, with 2710.75 and 2704.75
NASDAQ Futures
Buyers use dips as entry positions in the current formation- also a redux. The failure to breach higher will signal trouble here today as we see crosscurrents. We failed these regions on Tuesday and momentum has changed little. Range bound and with increasing price compression, a tone of caution is best in this space. The bullets below represent the likely shift of trading momentum at the successful or failed retests at the levels noted.
- Buying pressure intraday will likely strengthen with a bullish retest of 7096.75
- Selling pressure intraday will likely strengthen with a bearish retest of 7074.5
- Resistance sits near 7162.5 to 7179.5 with 7224.5 and 7257.5 above that.
- Support sits between 7078.5 and 7060.5, with 7034.5 and 7015.75 below that.
CHART
WTI Crude Oil
Nearby highs are holding and support edges are firming up -negative divergence intraday continues. Higher lows should still hold from larger time frames as our bullish environment remains strong. Use caution adding to your positions up at the new highs. The API and EIA reports will give us a bit more color here but deep fades should still find buyers. The bullets below represent the likely shift of trading momentum at the successful or failed retests at the levels noted.
- Buying pressure intraday will likely strengthen with a bullish retest of 74.9
- Selling pressure intraday will strengthen with a bearish retest of 73.5
- Resistance sits near 75.22 to 75.54, with 75.81 and 77.09 above that.
- Support holds near 74.03 to 73.58, with 72.74 and 72.27 below that.
CHART
Twitter: @AnneMarieTrades
The author trades stock market futures every day and may have a position in mentioned securities at the time of publication. Any opinions expressed herein are solely those of the author, and do not in any way represent the views or opinions of any other person or entity.


