Stock Market Futures Trading Considerations For November 2, 2017
The S&P 500 (INDEXSP:.INX) and Nasdaq (INDEXNASDAQ:.IXIC) are trading mixed on Thursday morning as the market tries to digest the price action before its next move. Stay alert and watch your levels!
Check out today’s economic calendar with a full rundown of releases. And note that the charts below are from our premium service and shared exclusively with See It Market readers.
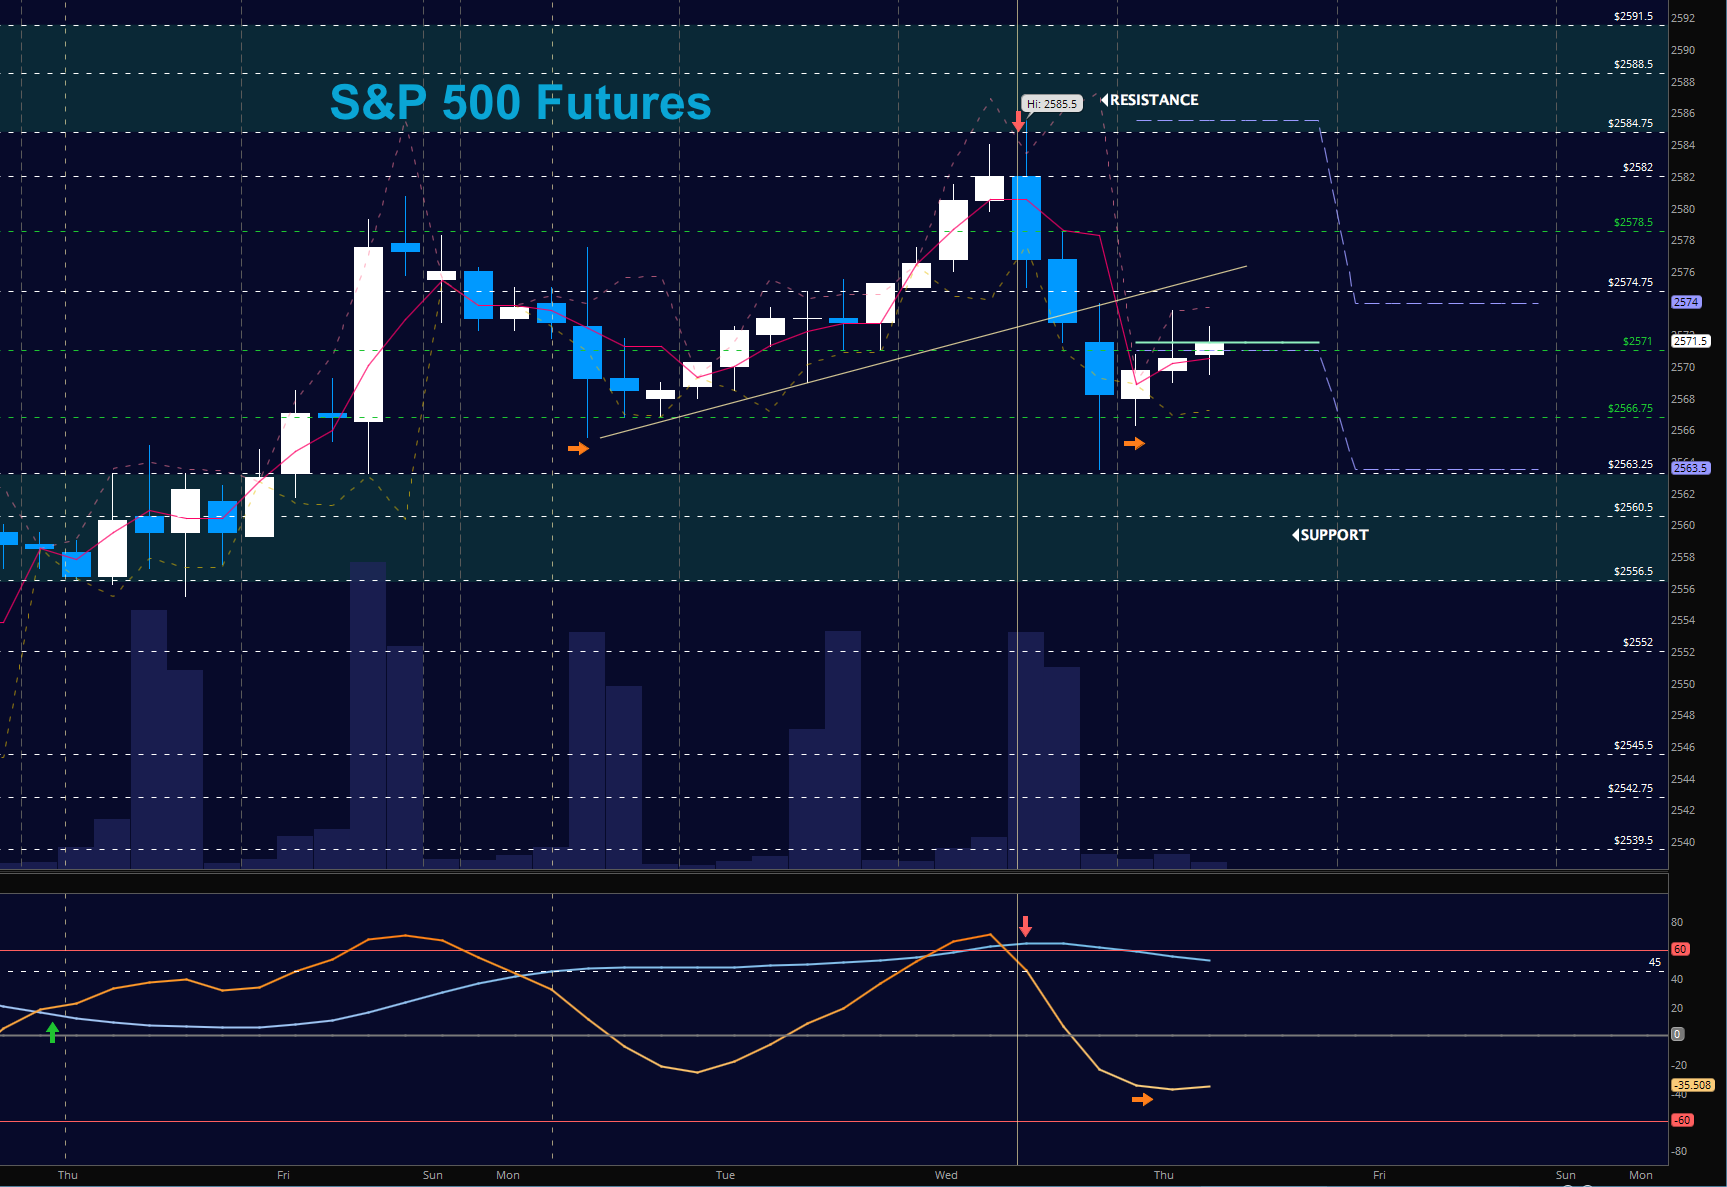
S&P 500 Futures
The TEST OF SUPPORT from five days prior give buyers a challenge event to rise above. Each dip has been following by a buying space and yesterday’s dip lasted only a few hours before buyers began to prop prices up. I’m watching for LOWER HIGHS and potential resistance to hold near 2578. We broke our upside Fibonacci target of 2584.75 but failed to hold it. Watch support regions to hold in the climb forward. The bullets below represent the likely shift of trading momentum at the positive or failed retests at the levels noted.
- Buying pressure intraday will likely strengthen above a positive retest of 2578.5
- Selling pressure intraday will likely strengthen with a failed retest of 2568.5
- Resistance sits near 2574.75 to 2578.5, with 2581.75 and 2585.5 above that.
- Support holds between 2566.5 and 2563.5, with 2560.5 and 2557.5 below that.
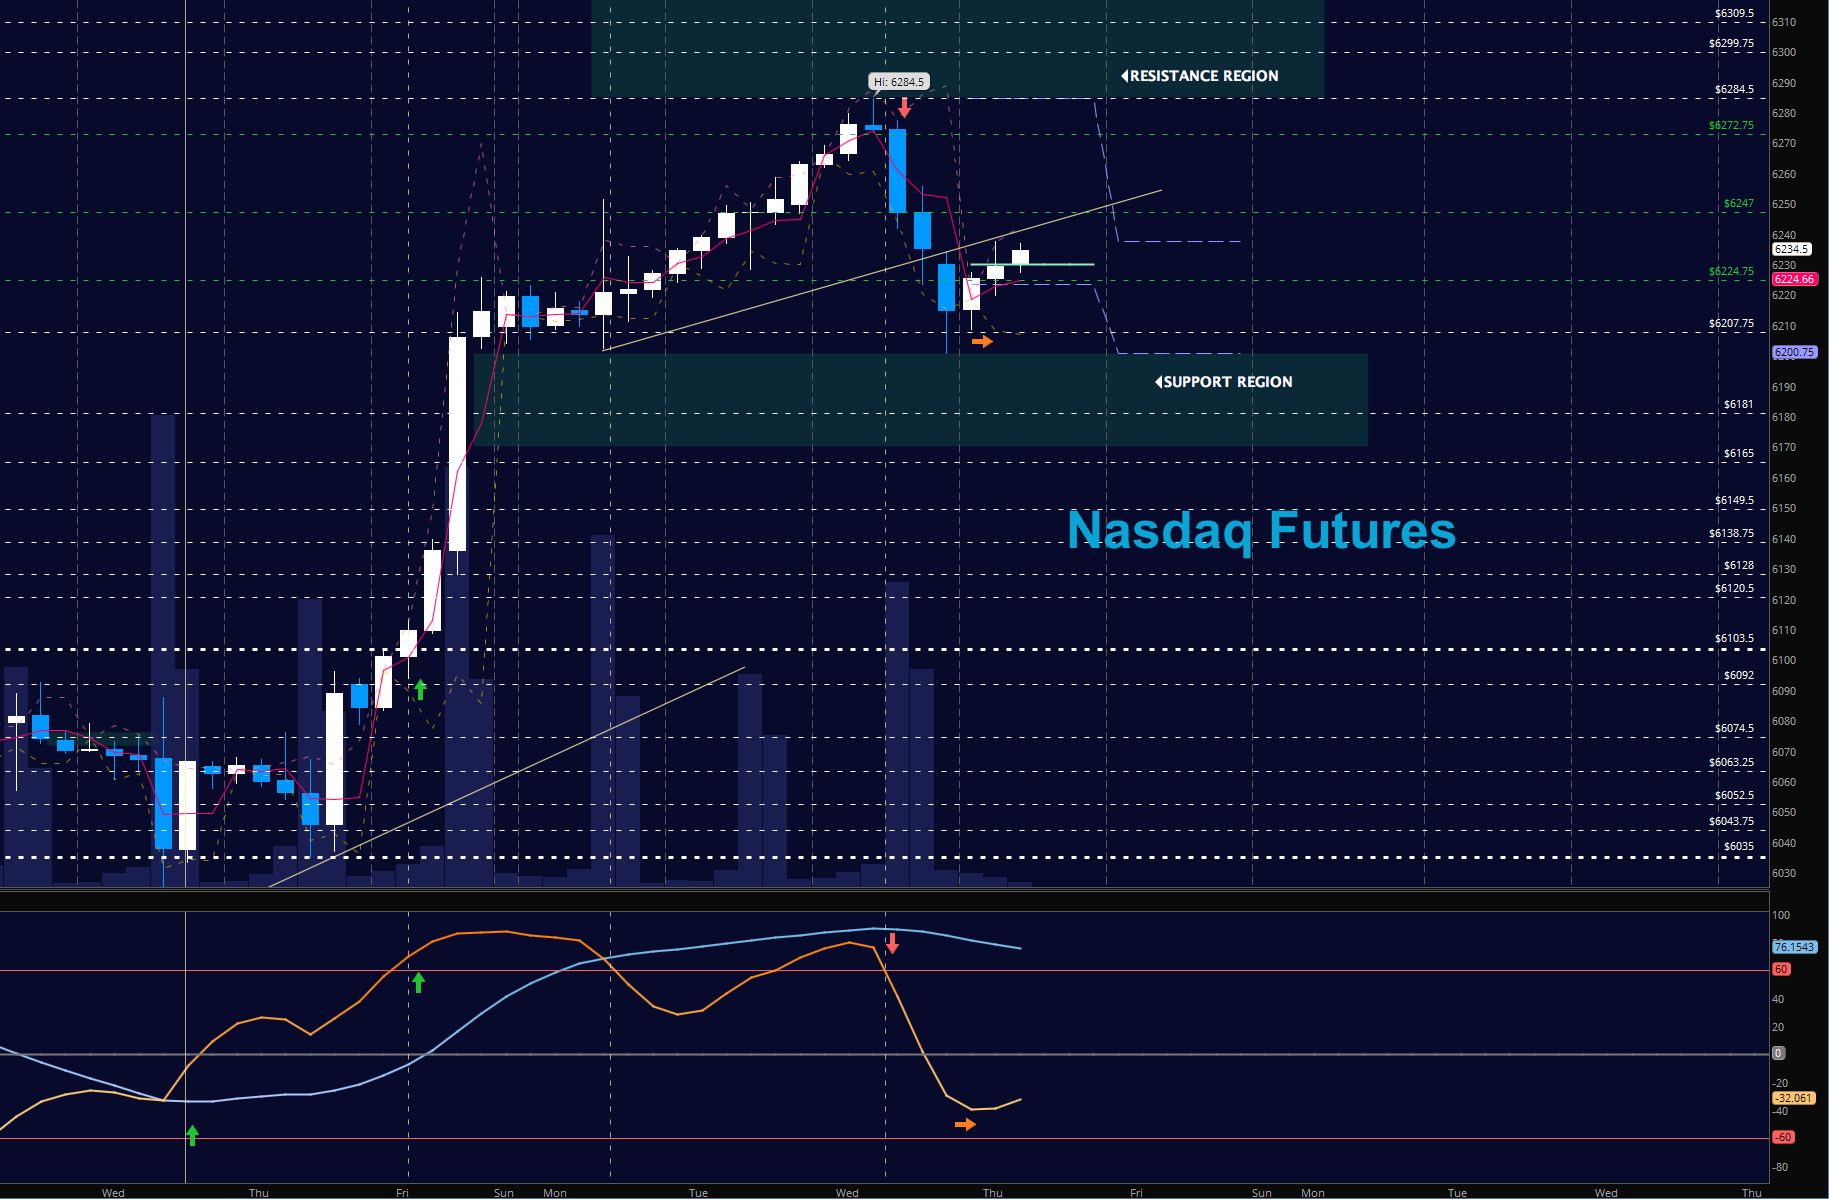
NASDAQ Futures
The NQ faded from its Fibonacci target at 6284.5 and never recaptured the space, moving into the base of support and the breakaway level near 6200. As long as we recapture 6256.75, buyers will hold strong. The bullets below represent the likely shift of intraday trading momentum at the positive or failed tests at the levels noted.
- Buying pressure intraday will likely strengthen with a positive retest of 6247.75
- Selling pressure intraday will likely strengthen with a failed retest of 6224.5
- Resistance sits near 6256.75 to 6262.75 with 6272.75 and 6284.5 above that.
- Support holds between 6209.25 and 6200.5, with 6194.75 and 6181.5 below that.
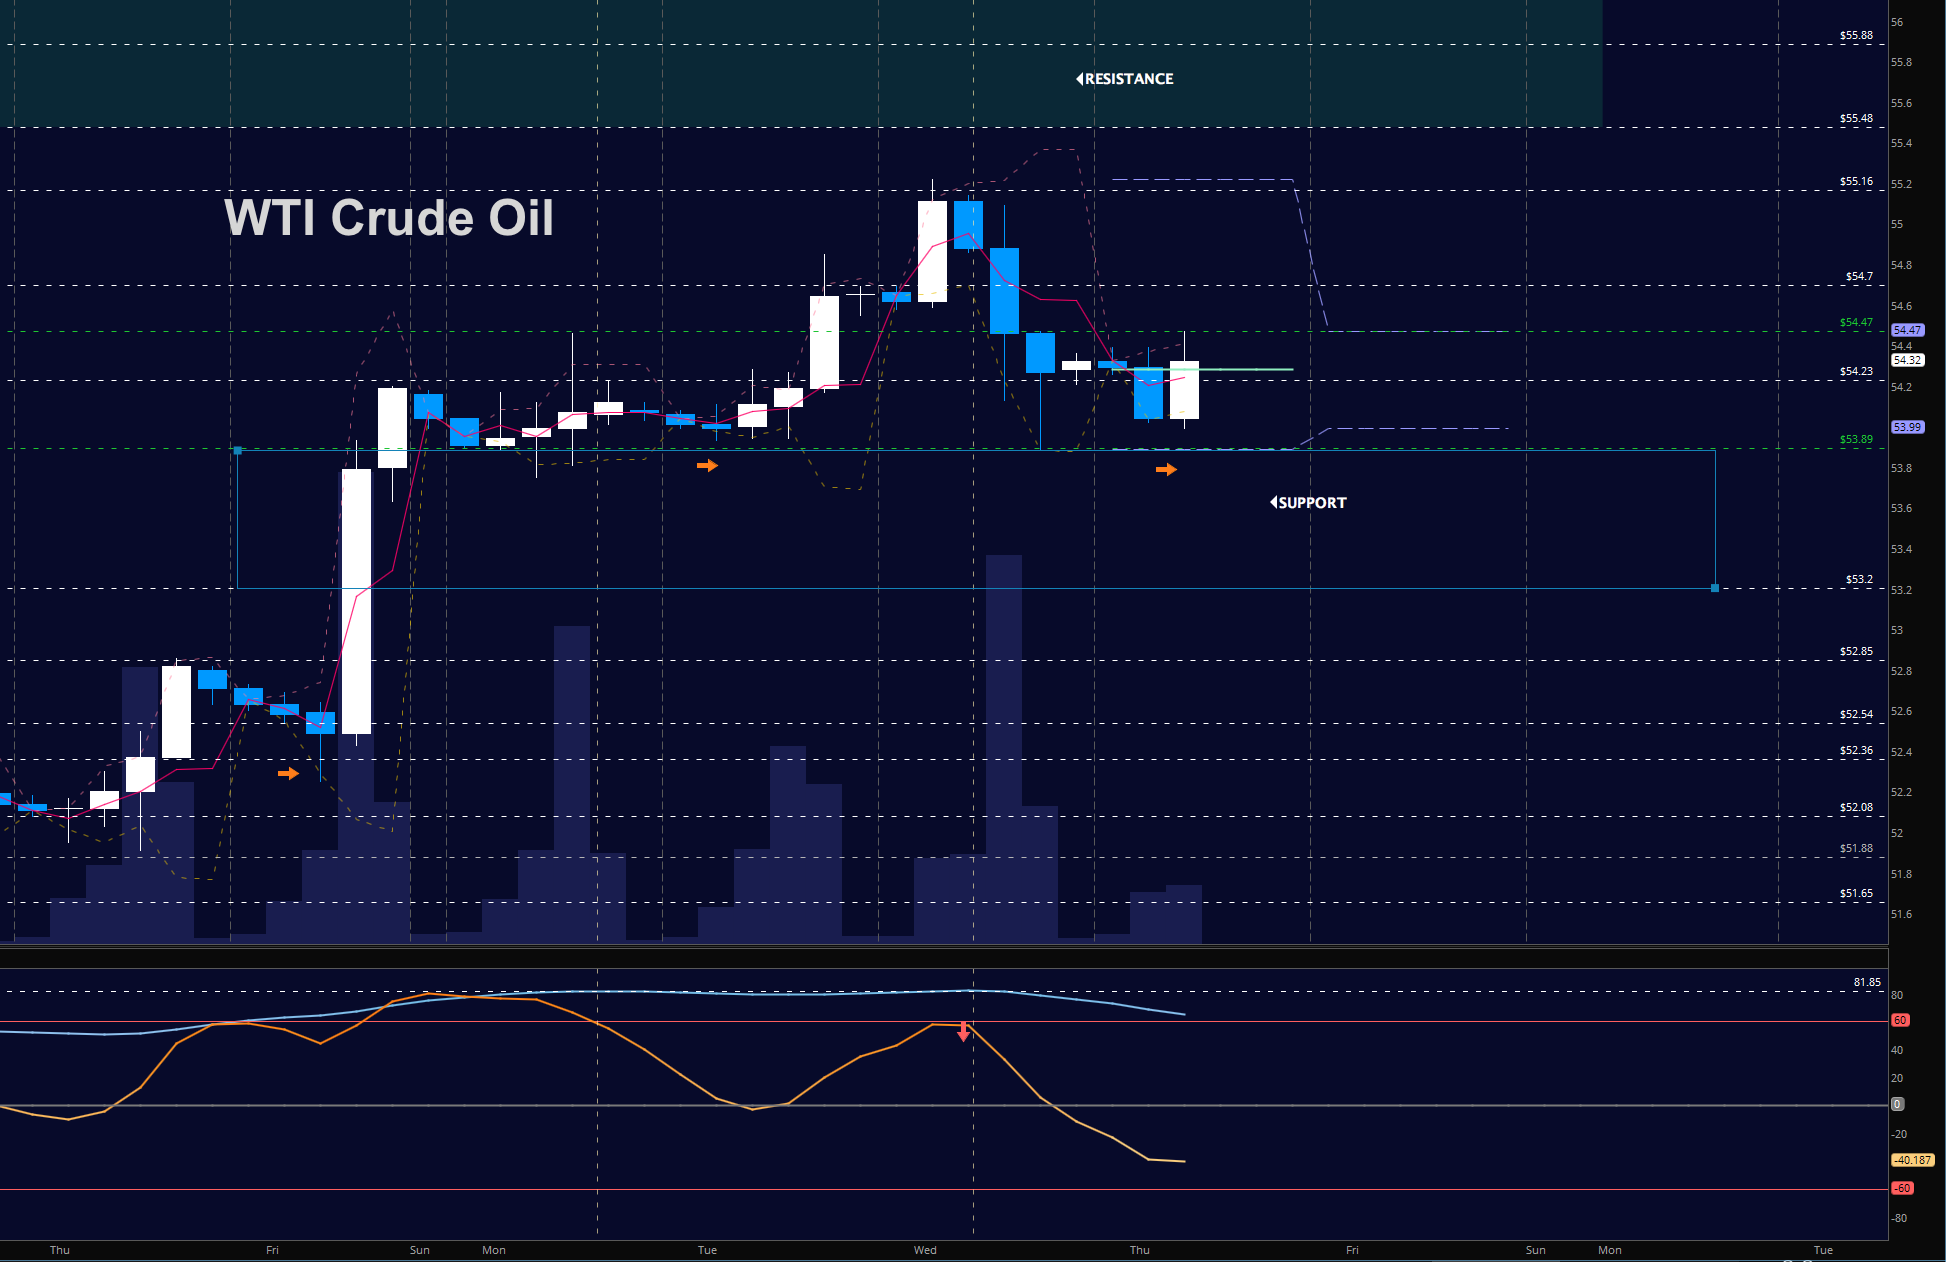
WTI Crude Oil
Oil faded off its Wednesday earning morning high with a drift back to the breakout levels near 54. Momentum is mildly bullish, but there is a clear line of defense the chart has to present to keep levels above 54 as there is a much bigger fade into 52.85 if the chart loses 53.8. The bullets below represent the likely shift of trading momentum at the positive or failed tests at the levels noted.
- Buying pressure intraday will likely strengthen with a positive retest of 54.7
- Selling pressure intraday will strengthen with a failed retest of 53.9
- Resistance sits near 55.04 to 55.22, with 55.48 and 55.88 above that.
- Support holds between 54.23 to 53.99, with 53.6 and 53.27 below that.
If you’re interested in the live trading room, it is now primarily stock market futures content, though we do track heavily traded stocks and their likely daily trajectories as well – we begin at 9am with a morning report and likely chart movements along with trade setups for the day.
As long as the trader keeps himself aware of support and resistance levels, risk can be very adequately managed to play in either direction as bottom picking remains a behavior pattern that is developing with value buyers and speculative traders.
Twitter: @AnneMarieTrades
The author trades stock market futures every day and may have a position in mentioned securities at the time of publication. Any opinions expressed herein are solely those of the author, and do not in any way represent the views or opinions of any other person or entity.


