Broad Stock Market Futures Outlook for May 29, 2018
Traders in the overnight action have pushed prices into deep support where we attempt bounces for the first time.
Trapped buyers should make the bounces difficult and lower lows are certainly quite possible in this environment.
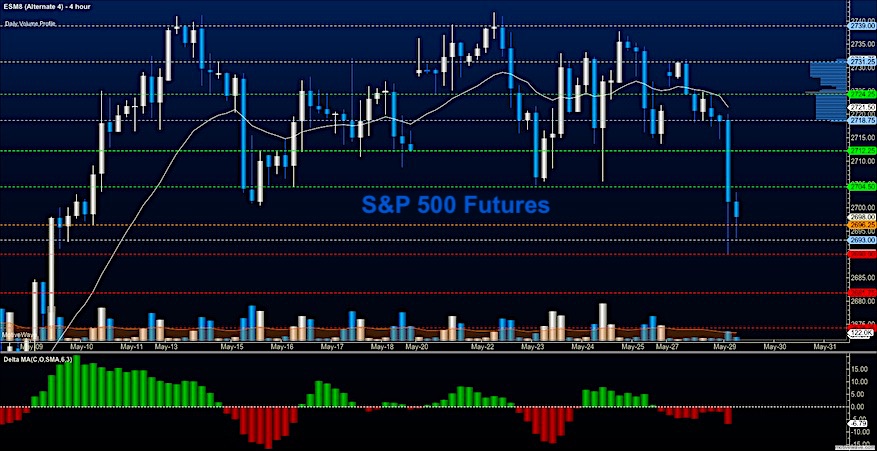
S&P 500 Futures
Lower support tested as bounces try to gain foothold – Traders need to breach 2704.25 and hold before buyers have any shot at continuation will allow for the press upward into lower resistance. The bullets below represent the likely shift of trading momentum at the successful or failed retests at the levels noted.
- Buying pressure intraday will likely strengthen with a bullish retest of 2706.75
- Selling pressure intraday will likely strengthen with a bearish retest of 2696.5
- Resistance sits near 2708.5. to 2712.75, with 2718.75 and 2726.75 above that.
- Support sits between 2700.75 and 2796.5, with 2693.5 and 2689.75
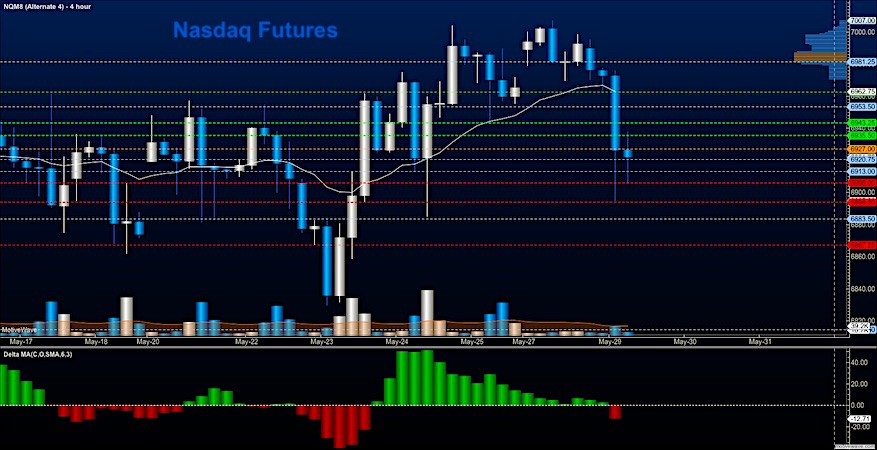
NASDAQ Futures
Tests of deeper support once more suggesting a failed bounce is on the horizon for NQ_F traders. Trapped buyers may significantly affect motion downward so shorting lows are ill-advised. The bullets below represent the likely shift of trading momentum at the successful or failed retests at the levels noted.
- Buying pressure intraday will likely strengthen with a bullish retest of 6931.75
- Selling pressure intraday will likely strengthen with a bearish retest of 6920.5
- Resistance sits near 6935.5 to 6943.25 with 6954.5 and 6969.25 above that.
- Support sits between 6913.5 and 6906.25, with 6894.75 and 6883.5 below that.
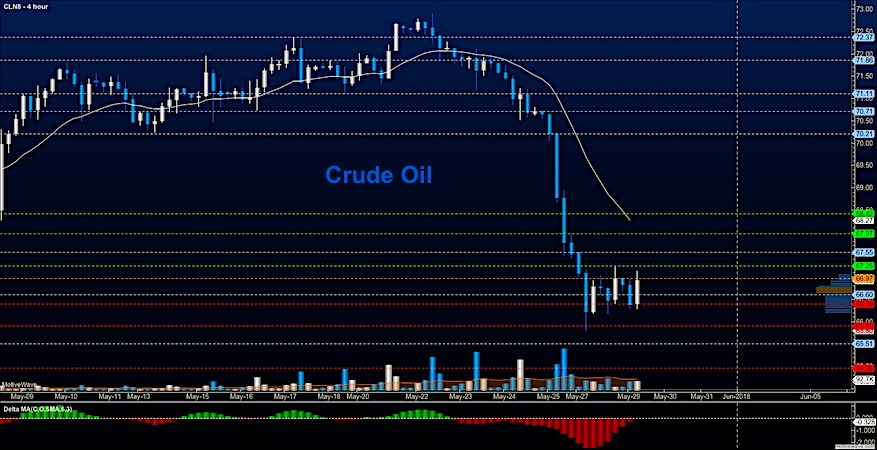
WTI Crude Oil
News about increased production sent oil sharply lower. Bounces are still likely to fade into support but the selling has slowed near 66.7 where we see some buyers at deep support regions. The breakout areas are still below – near 65.57, so I will be keeping an eye on the formations for any significant signals that we could fade again. The bullets below represent the likely shift of trading momentum at the successful or failed retests at the levels noted.
- Buying pressure intraday will likely strengthen with a bullish retest of 67.32
- Selling pressure intraday will strengthen with a bearish retest of 66.9
- Resistance sits near 67.25 to 67.55, with 67.9 and 68.85 above that.
- Support holds near 67.04 to 66.87, with 66.63 and 65.76 below that.
Twitter: @AnneMarieTrades
The author trades stock market futures every day and may have a position in mentioned securities at the time of publication. Any opinions expressed herein are solely those of the author, and do not in any way represent the views or opinions of any other person or entity.

: Worrisome to Broader Market?")

