Stock Market Futures Overview for July 31, 2018
As July draws to a close, traders are attempting another bounce pattern as they did yesterday on the S&P 500 (NYSEARCA: SPY). That bounce failed at resistance and today’s could experience the same fate.
Another feeble support bounce is building – as yesterday, this could hold into prior congestion before failing, else our buyers could gain a needed foothold here. Confidence in upward motion has not recovered.
These deeper dips have allowed volume profiles to fill in while support action still holds higher from a wider time frame.
S&P 500 Futures
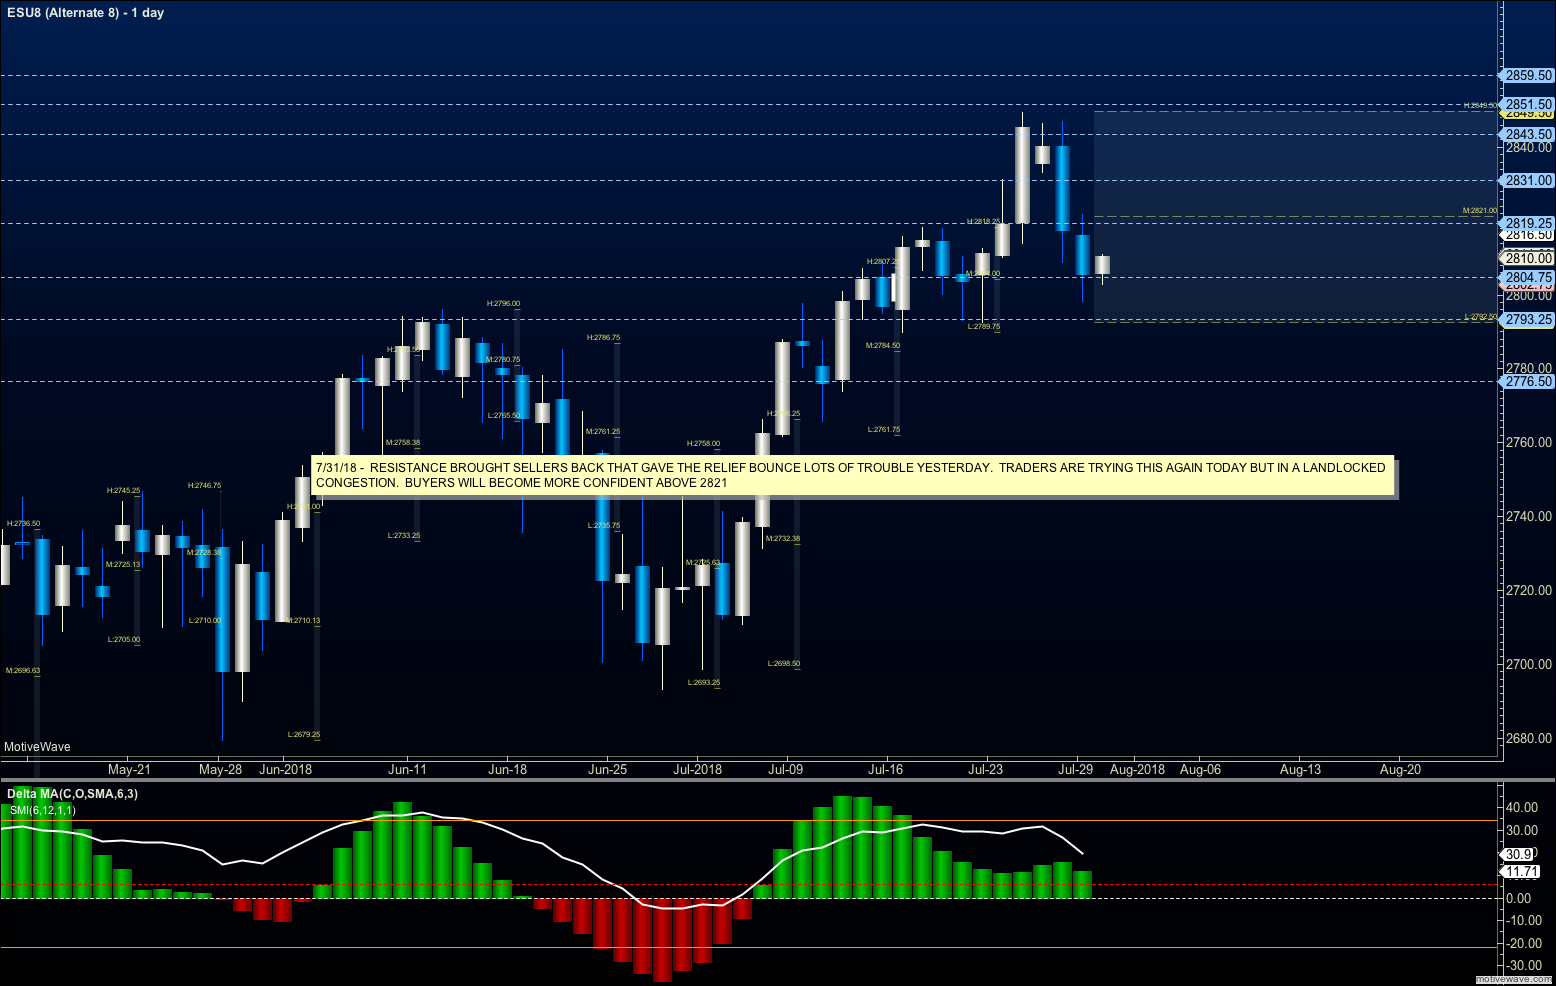
Buyers are on the hook to recover broken support for the second day in a row. Buyers know they need to recover above 2813.75 to draw more traders to the bullish bounce but sellers have been relentless this morning just above that level. Support is rising but still near the 2800 level. The bullets below represent the likely shift of intraday trading momentum at the successful or failed retests at the levels noted.
- Buying pressure intraday will likely strengthen with a bullish retest of 2813.5
- Selling pressure intraday will likely strengthen with a bearish retest of 2804.75
- Resistance sits near 2810.75 to 2818.25, with 2824.75 and 2836.75 above that.
- Support sits between 2806.75 and 2798.5, with 2794.25 and 2788.75
NASDAQ Futures
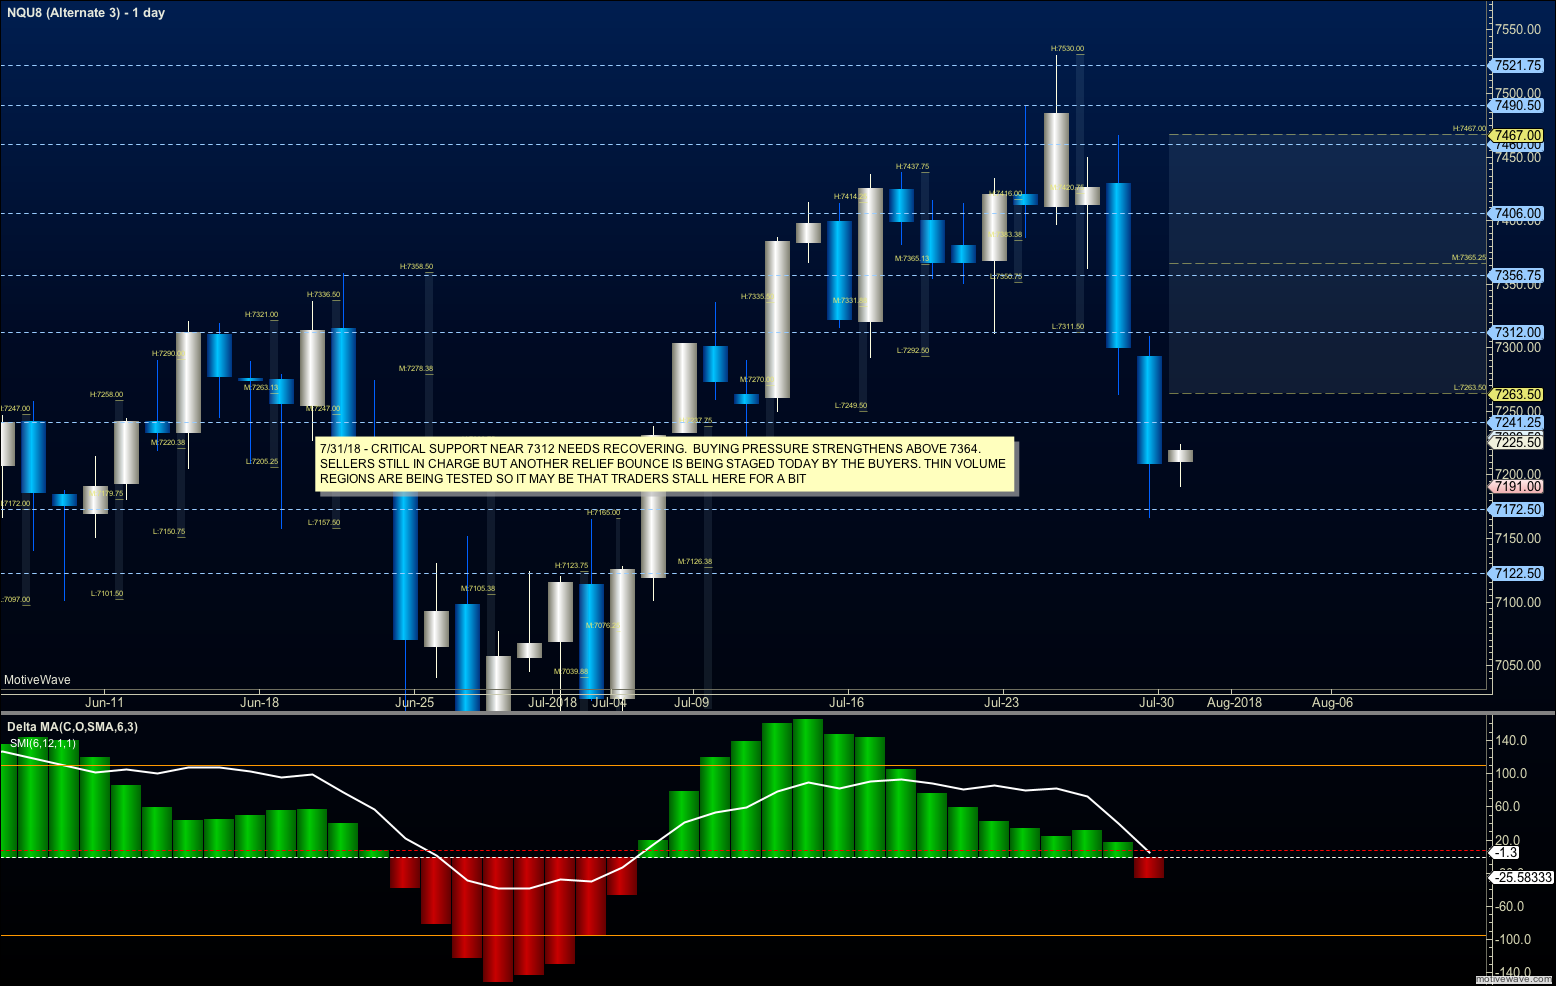
After a deep fade well into support near 7165, buyers began to lift this into 7220, now a resistance level of significance from an intraday perspective. A failed relief bounce yesterday looks like it is attempting a repeat but sellers are waiting above in the current formation. The chart is still bullish but thin volume spaces suggest that we may spend some time in these support regions to strengthen the price action overall which still looks bullish. Swing traders need to wait for this to settle out before taking long trades. The bullets below represent the likely shift of intraday trading momentum at the successful or failed retests at the levels noted.
- Buying pressure intraday will likely strengthen with a bullish retest of 7228.75
- Selling pressure intraday will likely strengthen with a bearish retest of 7194.5
- Resistance sits near 7225.5 to 7256.5 with 7287.5 and 7315.25 above that.
- Support sits between 7206.5 and 7189.75, with 7175.5 and 7146.75 below that.
WTI Crude Oil
Sellers are holding the lid on advancement past the 70 region effectively, thus far. Momentum is neutral to bullish as support, though broken in prior times, recovers and lifts from 69.04 which represents a support region today. Pullbacks will be buying regions as traders sit positioned in the grinding move press higher if the pressure continues. Failure to hold 69 will likely force buyers back to the 68.3 region. The bullets below represent the likely shift of intraday trading momentum at the successful or failed retests at the levels noted.
- Buying pressure intraday will likely strengthen with a bullish retest of 70.37
- Selling pressure intraday will strengthen with a bearish retest of 69.3
- Resistance sits near 70.14 to 70.46, with 70.74 and 71.17 above that.
- Support holds near 69.45 to 69.04, with 68.88 and 68.29 below that.
Twitter: @AnneMarieTrades
The author trades stock market futures every day and may have a position in mentioned securities at the time of publication. Any opinions expressed herein are solely those of the author, and do not in any way represent the views or opinions of any other person or entity.

 Testing Important Price Support")
: Cup (and Maybe Handle) Watch")


