Broad Stock Market Outlook for March 15, 2018
Charts are trying to stabilize this morning but choppy action persists. The broad stock market futures indices are hovering just above their lower support edges. For S&P 500 futures, support resides at 2751.
A failure to hold this support would send the S&P 500 into a deeper retrace that would continue the current countertrend “short” in the bigger picture. So buyers have something to prove here. Keep your eyes on support if you are thinking about going long and on resistance if you are considering going short. Those words may seem reversed but they are not – follow the strength of motion and if support breaks and does not recapture, the strength of motion will be SHORT (so we should not be long), and vice versa.
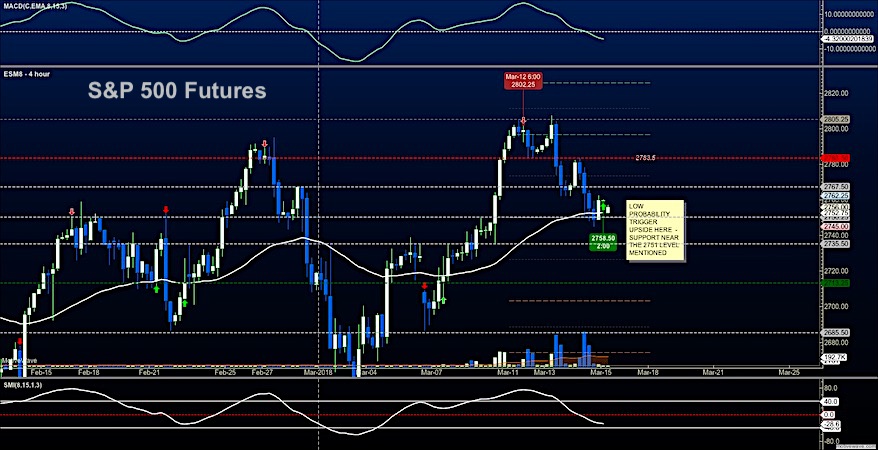
S&P 500 Futures
Support watch at 2751 – but lower highs are still presenting. We need to breach and hold 2762 before buyers can gather any traction. As momentum gets damp, we need to watch our edges carefully and assume range based trading until we break and hold through the edges. The bullets below represent the likely shift of trading momentum at the positive or failed retests at the levels noted.
- Buying pressure intraday will likely strengthen with a bullish retest of 2762.5
- Selling pressure intraday will likely strengthen with a bearish retest of 2750
- Resistance sits near 2762.5 to 2767.5, with 2779.75 and 2802.75 above that.
- Support sits between 2751.5 and 2745.75, with 2735.5 and 2729.50.
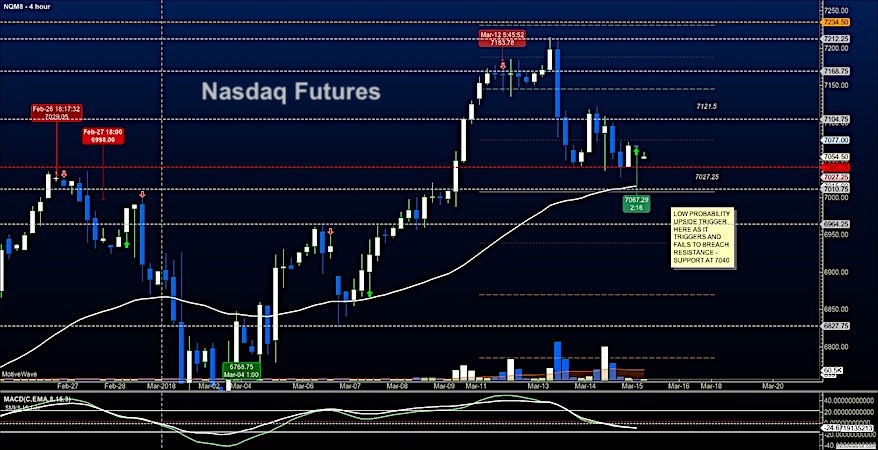
NASDAQ Futures
Lower highs and repeated tests of support make for tough trades in either direction here. My thought is that we wait for the failed retest of 7040 or the retested break above 7077. A failed retest below 7040 will likely give us a press into levels below 7000 – and a hold above 7077 will send us back to 7140 potentially. The bullets below represent the likely shift of intraday trading momentum at the positive or failed tests at the levels noted.
- Buying pressure intraday will likely strengthen with a bullish retest of 7077.5
- Selling pressure intraday will likely strengthen with a bearish retest of 7040
- Resistance sits near 7069 to 7104.5 with 7149.5 and 7202.5 above that.
- Support sits between 7040.5 and 7012.75, with 6997.75 and 6964.75 below that.
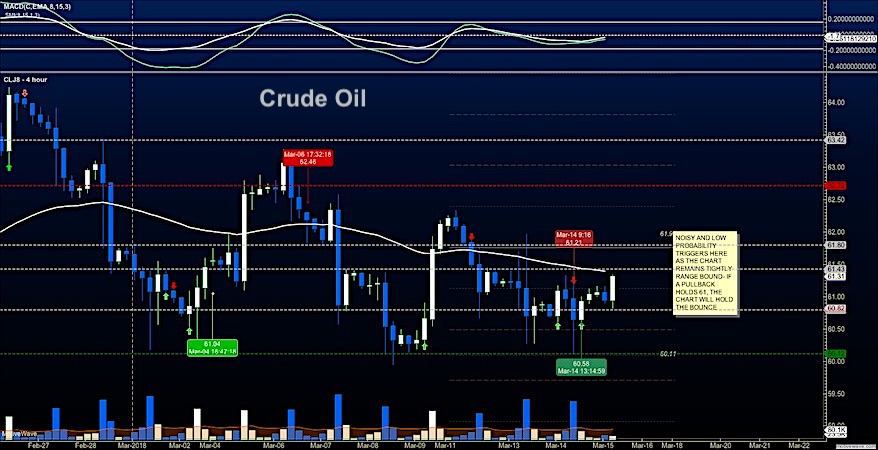
WTI Crude Oil
A bounce off support near 60.80 this morning is set to fail on the first pass into 61.45. If it pulls back and holds 61, we should have a fair bounce higher. Failure to breach and hold 61.4 will give us more noisy trading. The bullets below represent the likely shift of intraday trading momentum at the positive or failed tests at the levels noted.
- Buying pressure intraday will likely strengthen with a bullish retest of 61.56
- Selling pressure intraday will strengthen with a bearish retest of 60.98
- Resistance sits near 61.43 to 61.86, with 62.12 and 62.72 above that.
- Support holds near 60.8 to 60.46, with 60.12 and 59.76 below that.
Twitter: @AnneMarieTrades
The author trades stock market futures every day and may have a position in mentioned securities at the time of publication. Any opinions expressed herein are solely those of the author, and do not in any way represent the views or opinions of any other person or entity.


