Futures Market Trading Considerations For Sept 28, 2017
The S&P 500 (INDEXSP:.INX) is set for a slow start on Thursday. The bulls would like to see 2501 hold on S&P 500 futures and for tech stocks to show some strength. Key futures trading levels and analysis for S&P, Nasdaq, and crude oil below.
Check out today’s economic calendar with a full rundown of releases. And note that the charts below are from our premium service and shared exclusively with See It Market readers.
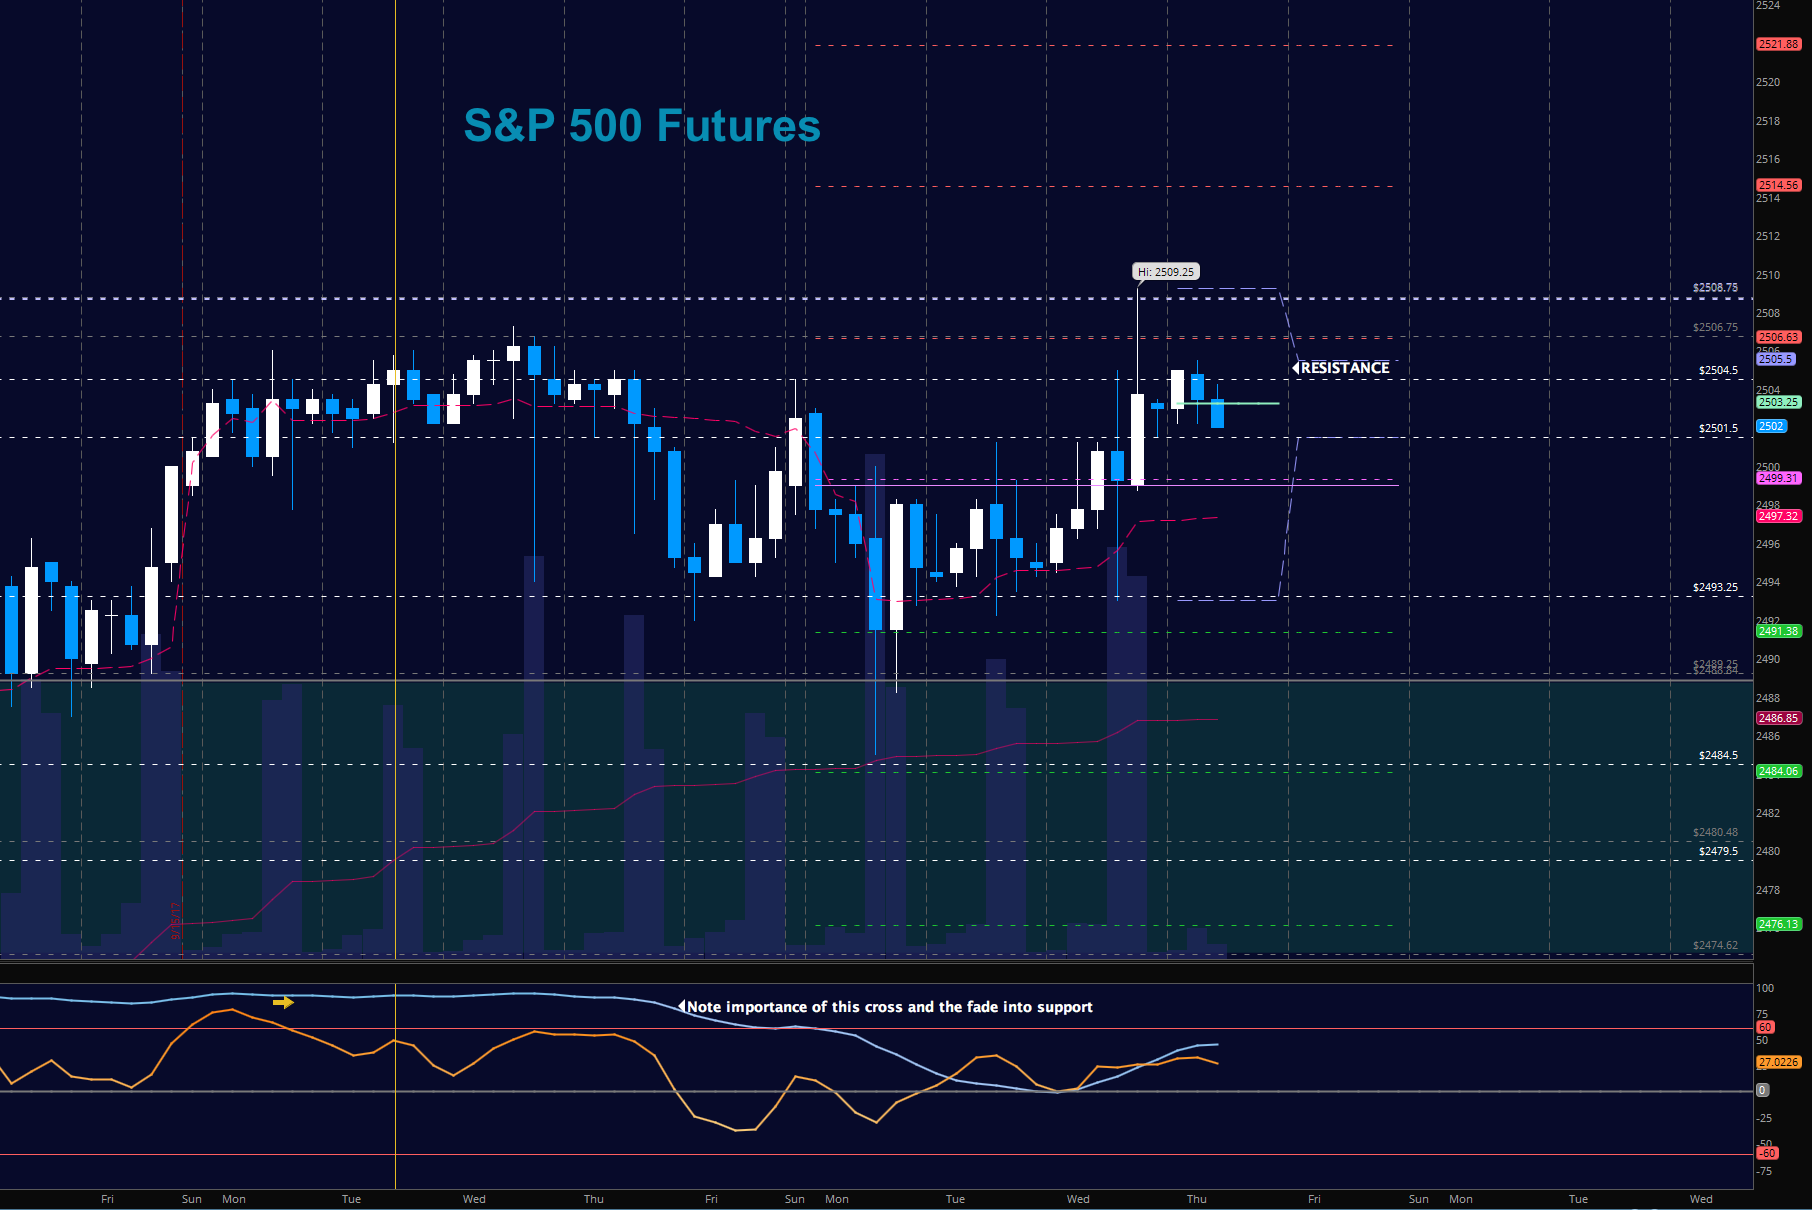
S&P 500 Futures (ES)
Last trading day of September. The charts as a whole are struggling against resistance. The ES_F faded to new higher support areas near 2501. I expect congested range bound behavior today. The bullets below represent the likely shift of trading momentum at the positive or failed retests at the levels noted.
- Buying pressure intraday will likely strengthen above a positive retest of 2506.5 (but only into resistance)
- Selling pressure intraday will likely strengthen with a failed retest of 2497
- Resistance sits near 2505.5 to 2509.25, with 2511.5 and 2514.5 above that.
- Support holds between 2497.5 and 2494.5, with 2491.5 and 2487.5 below that.
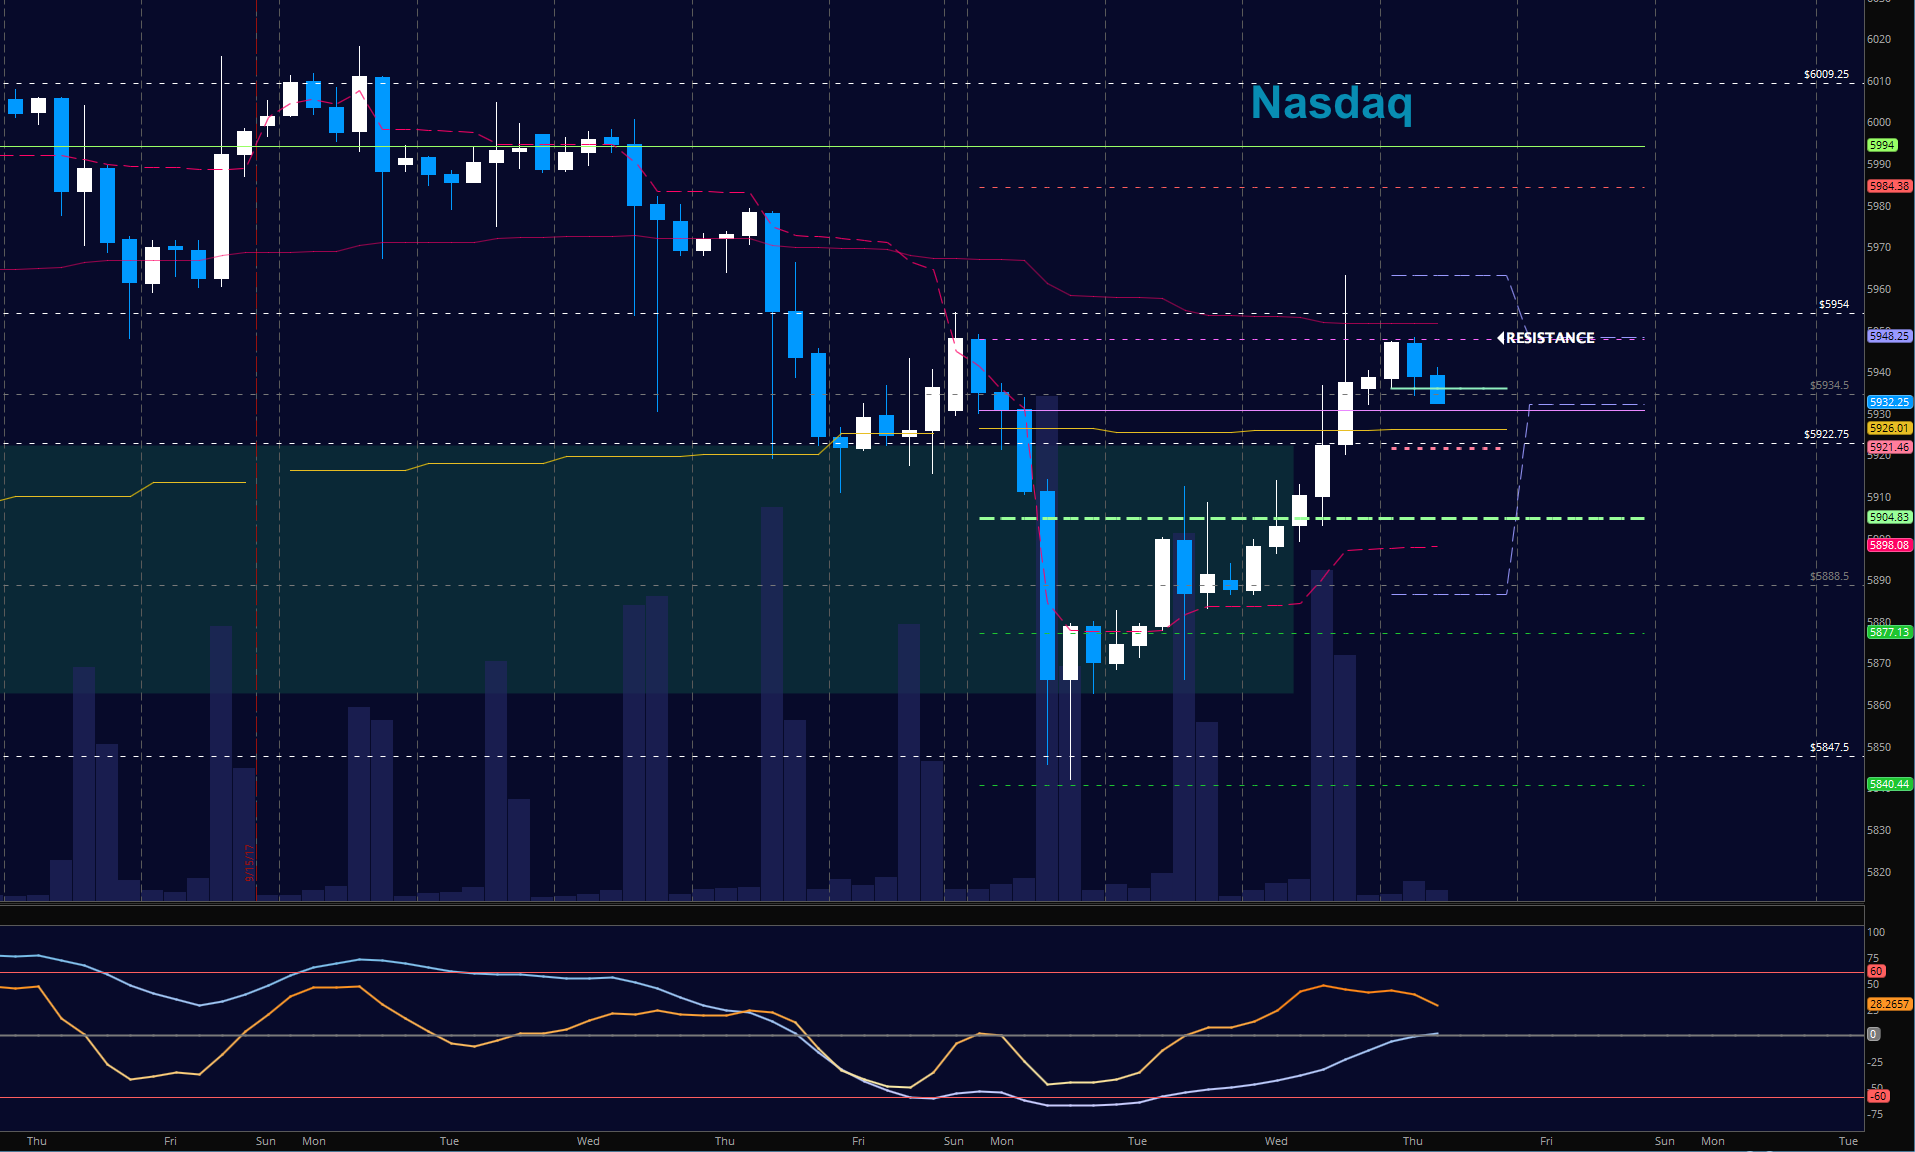
NASDAQ Futures (NQ)
Momentum still shows mixed to negative continuation so bounces are still likely to fail near resistance. Yesterday’s expansion seems likely to algorithmic stop running as it failed to hold any supports higher than anticipated…but that is just my supposition. Buyers need to hold 5935 to assume any measure of control here- and they seem to be struggling with the area. The bullets below represent the likely shift of intraday trading momentum at the positive or failed tests at the levels noted.
- Buying pressure intraday will likely strengthen with a positive retest of 5948.75 (but only into resistance)
- Selling pressure intraday will likely strengthen with a failed retest of 5920
- Resistance sits near 5941 to 5948.75, with 5962.5 and 5974.5 above that.
- Support holds between 5920.5 and 5912.75, with 5905.25 and 5888.5 below that.
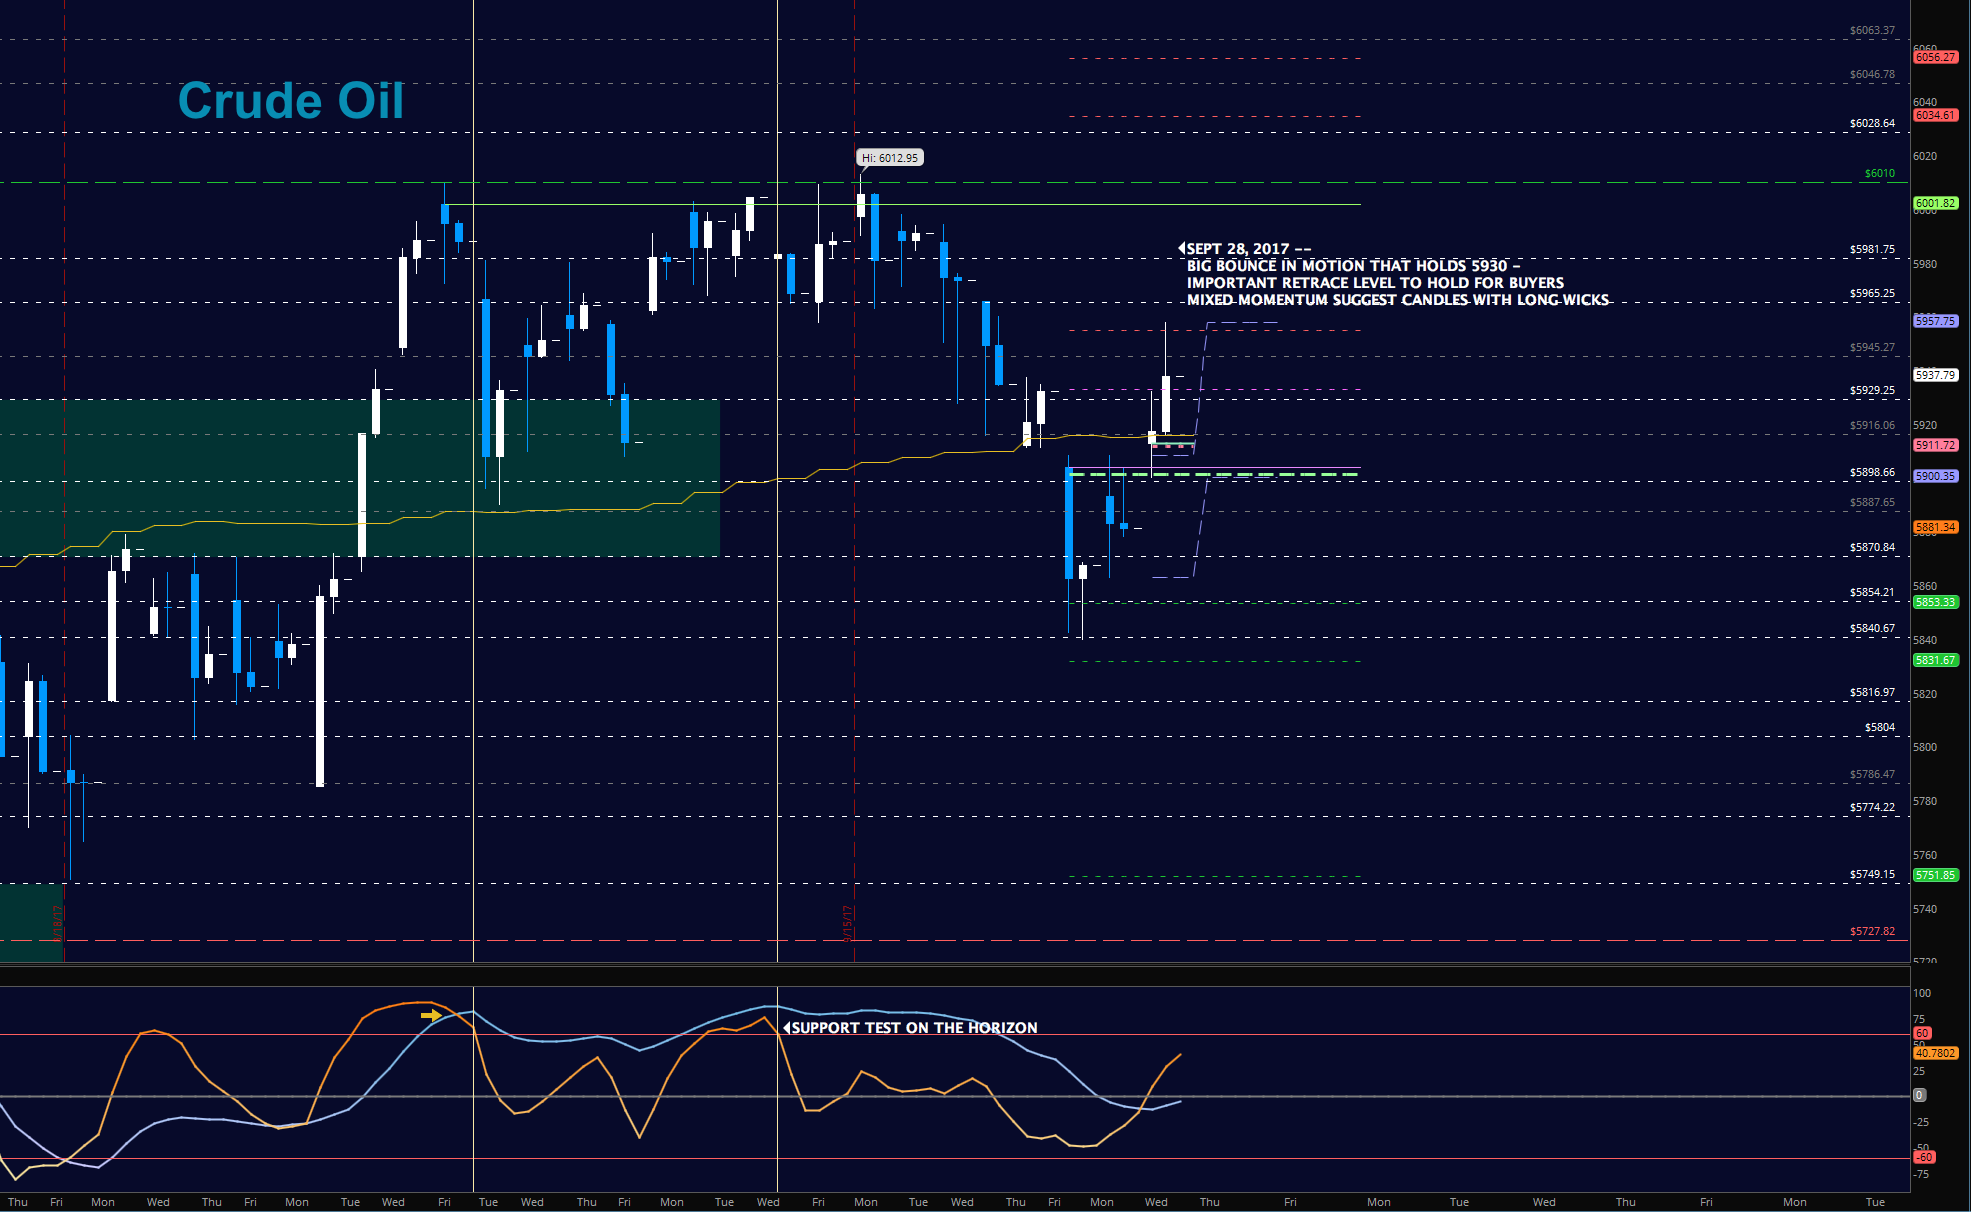
WTI Crude Oil
Oil is breaking out in the early morning finally, breaching 52.40 and testing resistance at 52.85. Buyers are in clear control so pullbacks should hold support levels and advance into 53.06 and potentially 53.83. The bullets below represent the likely shift of trading momentum at the positive or failed tests at the levels noted.
- Buying pressure intraday will likely strengthen with a positive retest of 52.43
- Selling pressure intraday will strengthen with a failed retest of 51.85
- Resistance sits near 52.4 to 52.85, with 53.06 and 53.83 above that.
- Support holds between 52.34 to 52.14, with 51.86 and 51.39 below that.
If you’re interested in the live trading room, it is now primarily stock market futures content, though we do track heavily traded stocks and their likely daily trajectories as well – we begin at 9am with a morning report and likely chart movements along with trade setups for the day.
As long as the trader keeps himself aware of support and resistance levels, risk can be very adequately managed to play in either direction as bottom picking remains a behavior pattern that is developing with value buyers and speculative traders.
Twitter: @AnneMarieTrades
The author trades stock market futures every day and may have a position in mentioned securities at the time of publication. Any opinions expressed herein are solely those of the author, and do not in any way represent the views or opinions of any other person or entity.


")
