Stock Market Outlook for S&P 500 Futures November 9, 2016 –
Another stunning evening unfolded for the media yesterday as Republicans swept the White House, The Senate and the House. All eyes will be watching the first few hours of trading on the S&P 500 (INDEXSP:.INX) today.
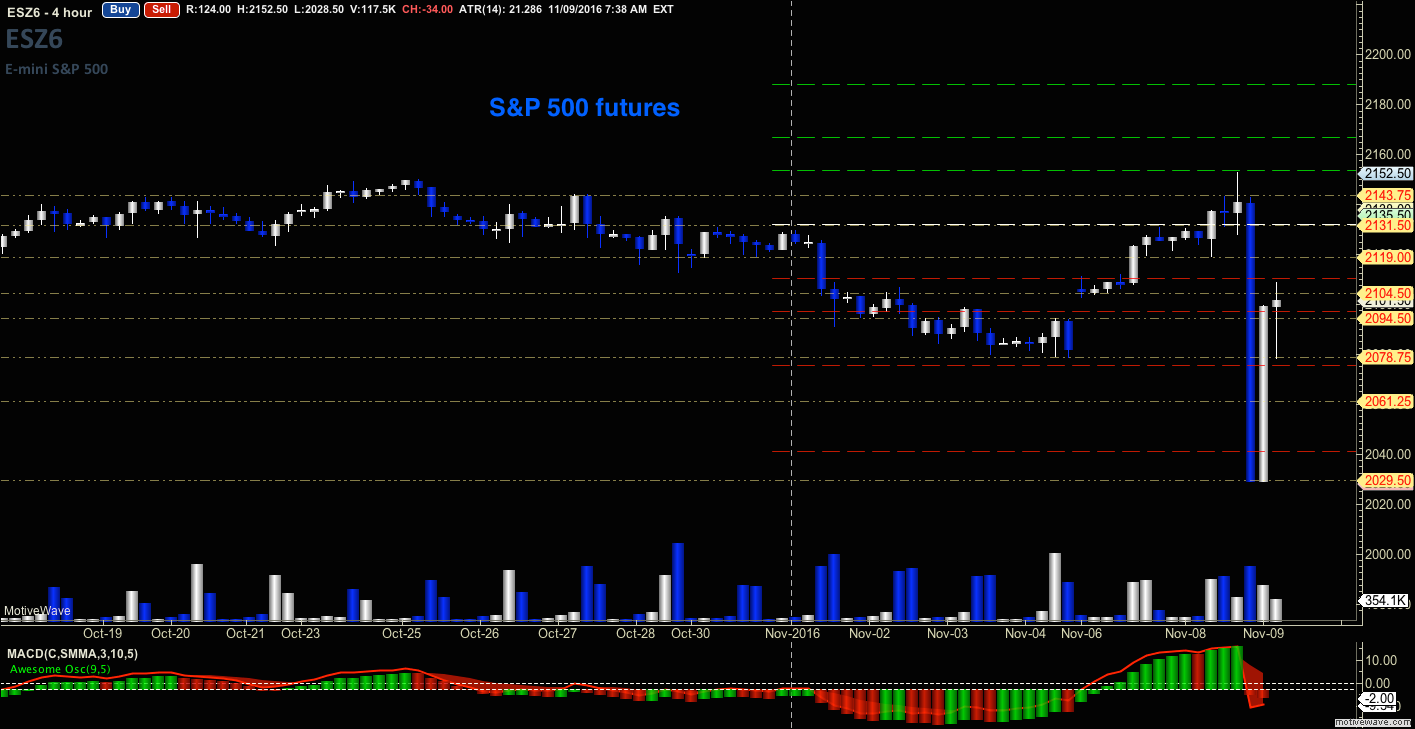
To recap, the global markets fell like a stone with S&P 500 futures dropping into deep support near 2029. However, the futures markets reversed higher after midnight. As many traders who try to look for the real lines of motion, this morning presents a few questions. To me, the line in the sand intraday will be 2081.50 – above there and buyers will move to press forward. Below that, sellers will be in greater command of the motion. At this time of writing, price resistance lies in the regions near 2109 to 2119 – buying will accelerate if/when those levels break.
See today’s economic calendar with a rundown of releases.
TODAY’S RANGE OF MOTION
S&P 500 Futures Trading Chart – November 9
Upside trades for S&P 500 futures – Two options:
Positive retest of continuation level – 2106.50
Positive retest of support level – 2075.5
Opening targets ranges – 2082.5, 2090.50, 2095.25, 2100.25, and 2106.50
Downside trades for S&P 500 futures – Two options:
Failed retest of resistance level – 2106
Failed retest of support level – 2081.5 (notice there could be a bounce waiting at 2075ish)
Opening targets ranges – 2101.50, 2096.50, 2091.25, 2085.75, 2081.5, 2075.75, and 2066.5
NASDAQ FUTURES
The NQ_F fell in tandem with the ES_F falling over 200 points into one of the support levels we saw several weeks back near 4557. Today’s line in the sand sits near 4648 as demarcation between buying and selling power. Resistance levels have been shifted up into 4710.75 to 4725
Upside trades for Nasdaq futures – Two options:
Positive retest of continuation level – 4710.5
Positive retest of support level – 4648.5
Opening targets ranges for non-members – 4654.50, 4660.50, 4668.75, 4689.50, and 4723.25
Downside trades for Nasdaq futures – Two options:
Failed retest of resistance level – 4685.50
Failed retest of support level – 4660.50 (notice bounce potential at 4648.5)
Opening targets ranges for non-members – 4680.75, 4670.75, 4665.75, 4649.75, and 4631
CRUDE OIL
History says that dips in the price of oil come after election cycles, and combined with the build yesterday from the API release, along with OPEC commentary, we should have a day that fades bounces. The EIA report is ahead at 10:30am eastern. We tested support lows below 43.4, and resistance remains near 45.3
Upside trades for crude oil futures – Two options:
Positive retest of continuation level – 45.4
Positive retest of support level – 44.13
Opening targets ranges for non-members – 44.45, 44.87, 45.06, 45.32, and 45.56
Downside trades for crude oil – Two options:
Failed retest of resistance level – 44.75
Failed retest of support level – 44.13
Opening targets ranges for non-members – 44.48, 44.30, 44.11, 43.85, 43.44, and 43.07
If you’re interested in watching these trades go live, join us in the live trading room from 9am to 11:30am each trading day. Further details and additional targets are in the Members Only portion of the blog.
Visit TheTradingBook.com for more information.
If you’re interested in the live trading room, it is now primarily futures content, though we do track heavily traded stocks and their likely daily trajectories as well – we begin at 9am with a morning report and likely chart movements along with trade setups for the day.
As long as the trader keeps himself aware of support and resistance levels, risk can be very adequately managed to play in either direction as bottom picking remains a behavior pattern that is developing with value buyers and speculative traders.
If you’re interested in the live trading room, it is now primarily stock market futures content, though we do track heavily traded stocks and their likely daily trajectories as well – we begin at 9am with a morning report and likely chart movements along with trade setups for the day.
As long as the trader keeps himself aware of support and resistance levels, risk can be very adequately managed to play in either direction as bottom picking remains a behavior pattern that is developing with value buyers and speculative traders.
Twitter: @AnneMarieTrades
The author trades stock market futures every day and may have a position in mentioned securities at the time of publication. Any opinions expressed herein are solely those of the author, and do not in any way represent the views or opinions of any other person or entity.


: Creating Bullish Divergence?")


