S&P 500 Futures Trading Considerations For June 7, 2017
This morning likely becomes a staging point for the S&P 500 (INDEXSP:.INX) to bounce further into resistance in the chart. How the market reacts this morning will be telling near-term.
Check out today’s economic calendar with a full rundown of releases. And note that the charts below are from our premium service at The Trading Book and are shared exclusively with See It Market readers.
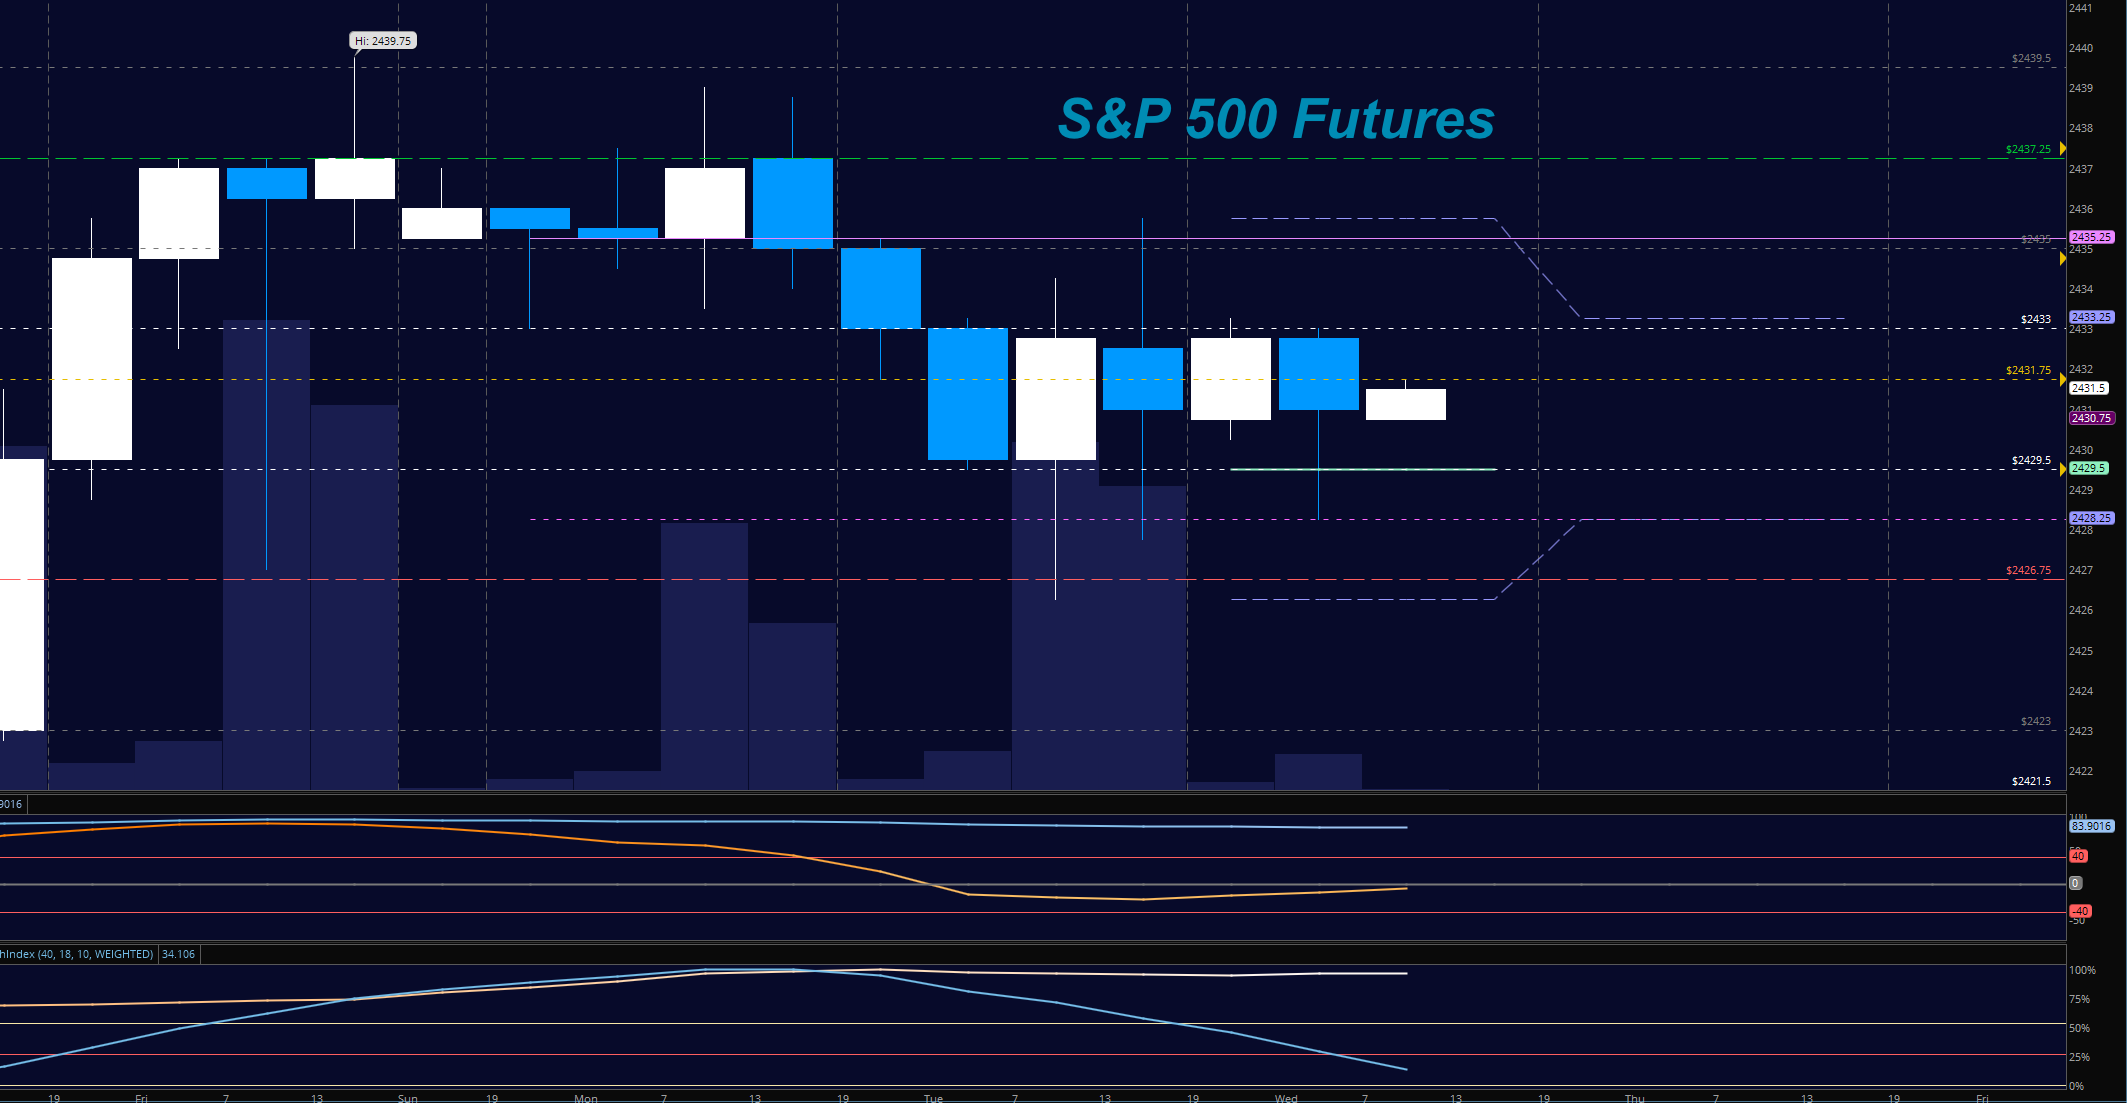
S&P 500 Futures (ES)
The key will be whether the chart can breach and hold 2435.5. As it sits, long action is not suggested at the breakout, but instead at support bounces near 2428. Value areas near 2426 still hold. Use caution trading short on the lows of the candles – you are likely to incur higher levels of risk this way today as we are looking at higher lows in the morning formations. The bullets below represent the likely shift of trading momentum at the positive or failed retests at the levels noted.
- Buying pressure intraday will likely strengthen above a positive retest of 2435.5 (though that is resistance for now)
- Selling pressure intraday will likely strengthen with a failed retest of 2426.5
- Resistance sits near 2435.5 to 2437.75, with 2441.5 and 2447.75 above that.
- Support holds between 2429.75 and 2426.5, with 2423.25 and 2413.75 below that.
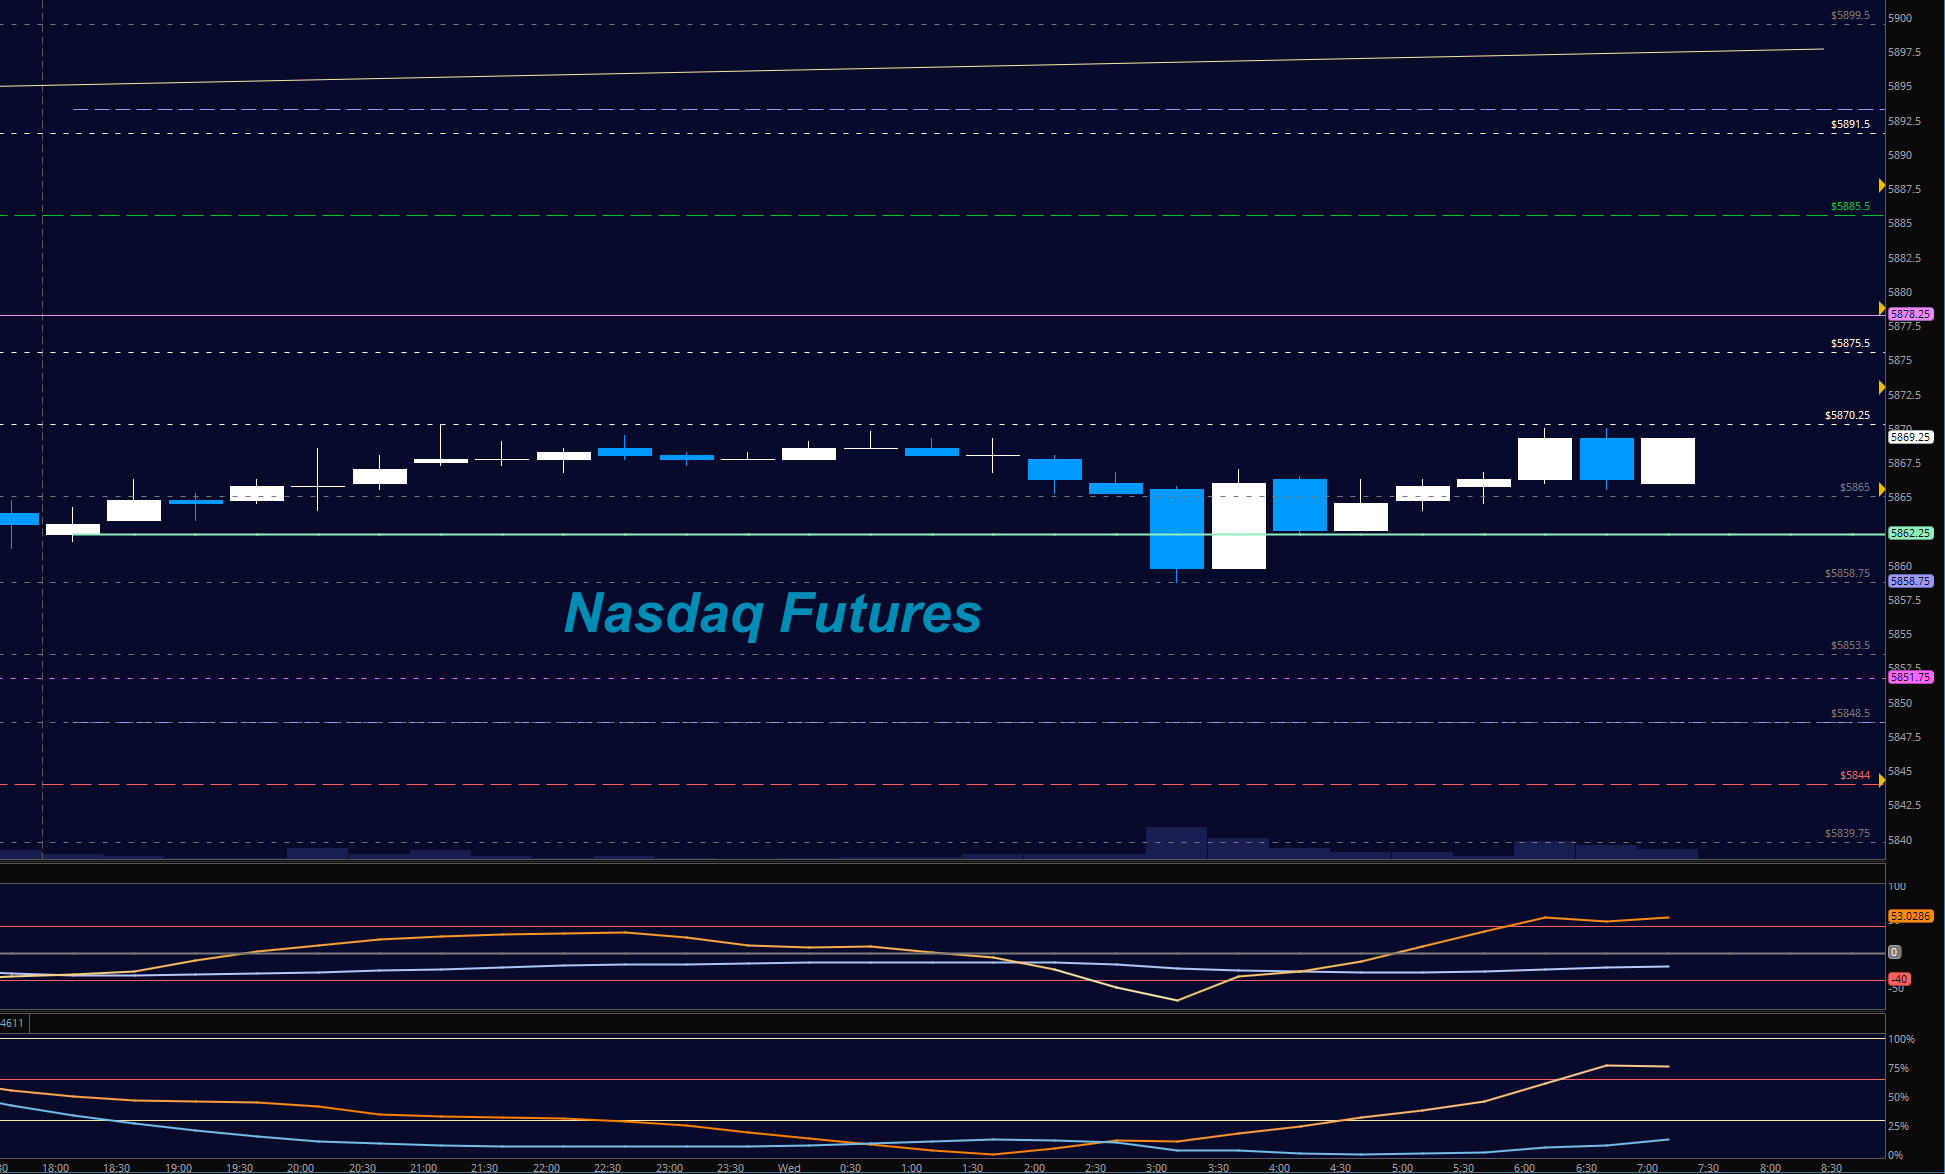
NASDAQ Futures (NQ)
Sharp moves into support levels that immediately begin bouncing are bullish in nature, but lower highs are on the watch events. Buyers now hold 5858.5 as support, with the complete retracement of the move between Thursday and Friday near 5844. The bullets below represent the likely shift of intraday trading momentum at the positive or failed tests at the levels noted.
- Buying pressure intraday will likely strengthen with a positive retest of 5871.5
- Selling pressure intraday will likely strengthen with a failed retest of 5858
- Resistance sits near 5878.5 to 5886.75, with 5893.75 and 5906.75 above that.
- Support holds between 5862.25 and 5858, with 5851.5 and 5824.25 below that.
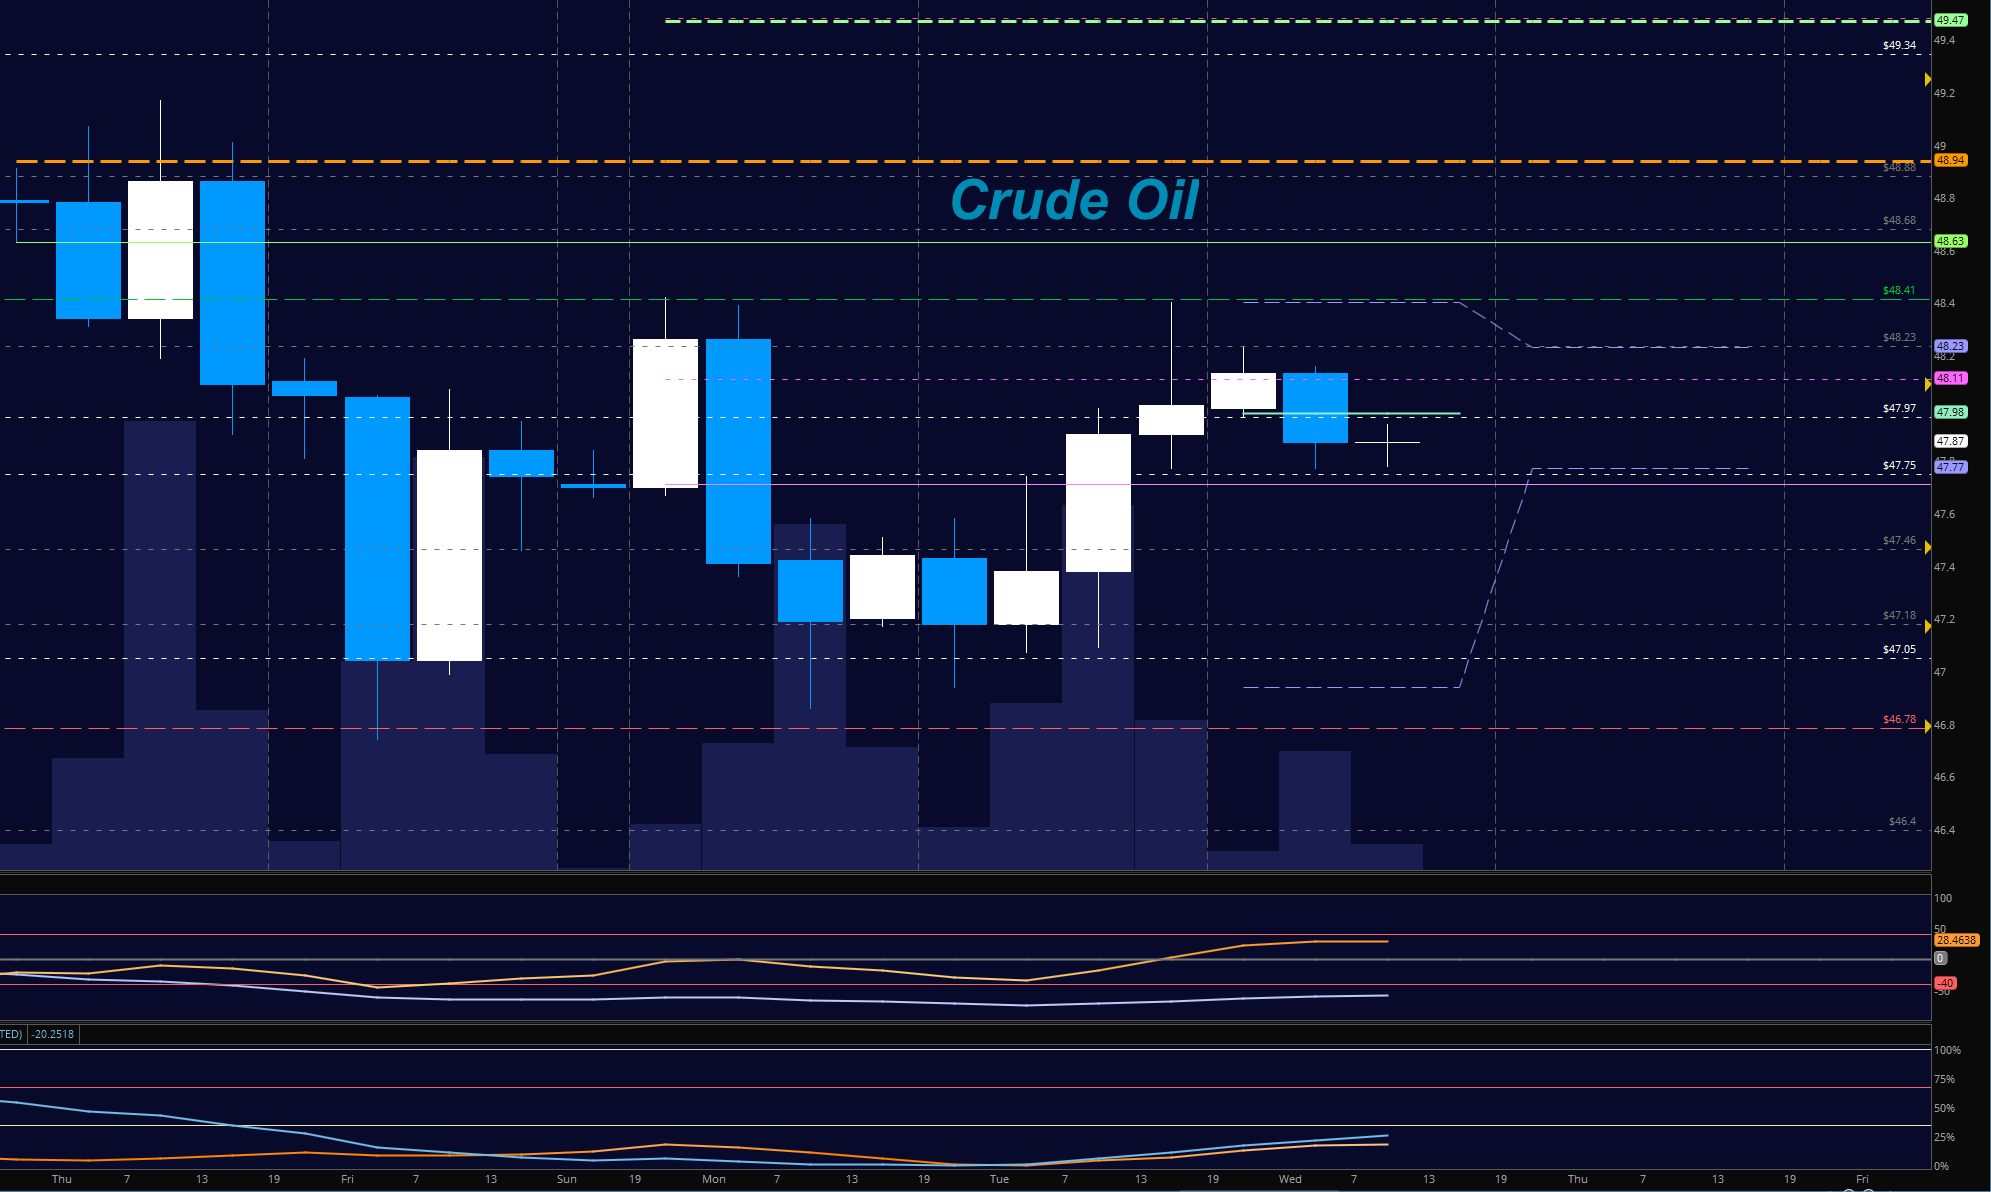
WTI Crude Oil
Basing formations hold 47 as support in the WTI for now. The API release yesterday was bullish news for traders to bounce us into congestion near 47.7 – a key region that buyers need to hold if we are to continue into the targets upside around 49.2. The EIA report is to be released at 10:30 ET. The bullets below represent the likely shift of trading momentum at the positive or failed tests at the levels noted.
- Buying pressure intraday will likely strengthen with a positive retest of 48.28
- Selling pressure intraday will strengthen with a failed retest of 47.65
- Resistance sits near 48.28 to 48.41, with 48.89 and 49.2 above that.
- Support holds between 47.56 and 47.2, with 46.78 and 46.4 below that.
Our live trading room is now primarily stock market futures content, though we do track heavily traded stocks and their likely daily trajectories as well – we begin at 9am with a morning report and likely chart movements along with trade setups for the day.
As long as the trader keeps himself aware of support and resistance levels, risk can be very adequately managed to play in either direction as bottom picking remains a behavior pattern that is developing with value buyers and speculative traders.
Twitter: @AnneMarieTrades
The author trades stock market futures every day and may have a position in mentioned securities at the time of publication. Any opinions expressed herein are solely those of the author, and do not in any way represent the views or opinions of any other person or entity.


