Stock Market Futures Considerations For June 19, 2017
Range bound motion on the S&P 500 (INDEXSP:.INX) continues this morning as we approach resistance once more. We are breaking above the top of the range resistance near 2440.5 to 2443.5. Breakouts seem likely with a run of stops ahead.
Check out today’s economic calendar with a full rundown of releases. And note that the charts below are from our premium service at The Trading Book and are shared exclusively with See It Market readers.
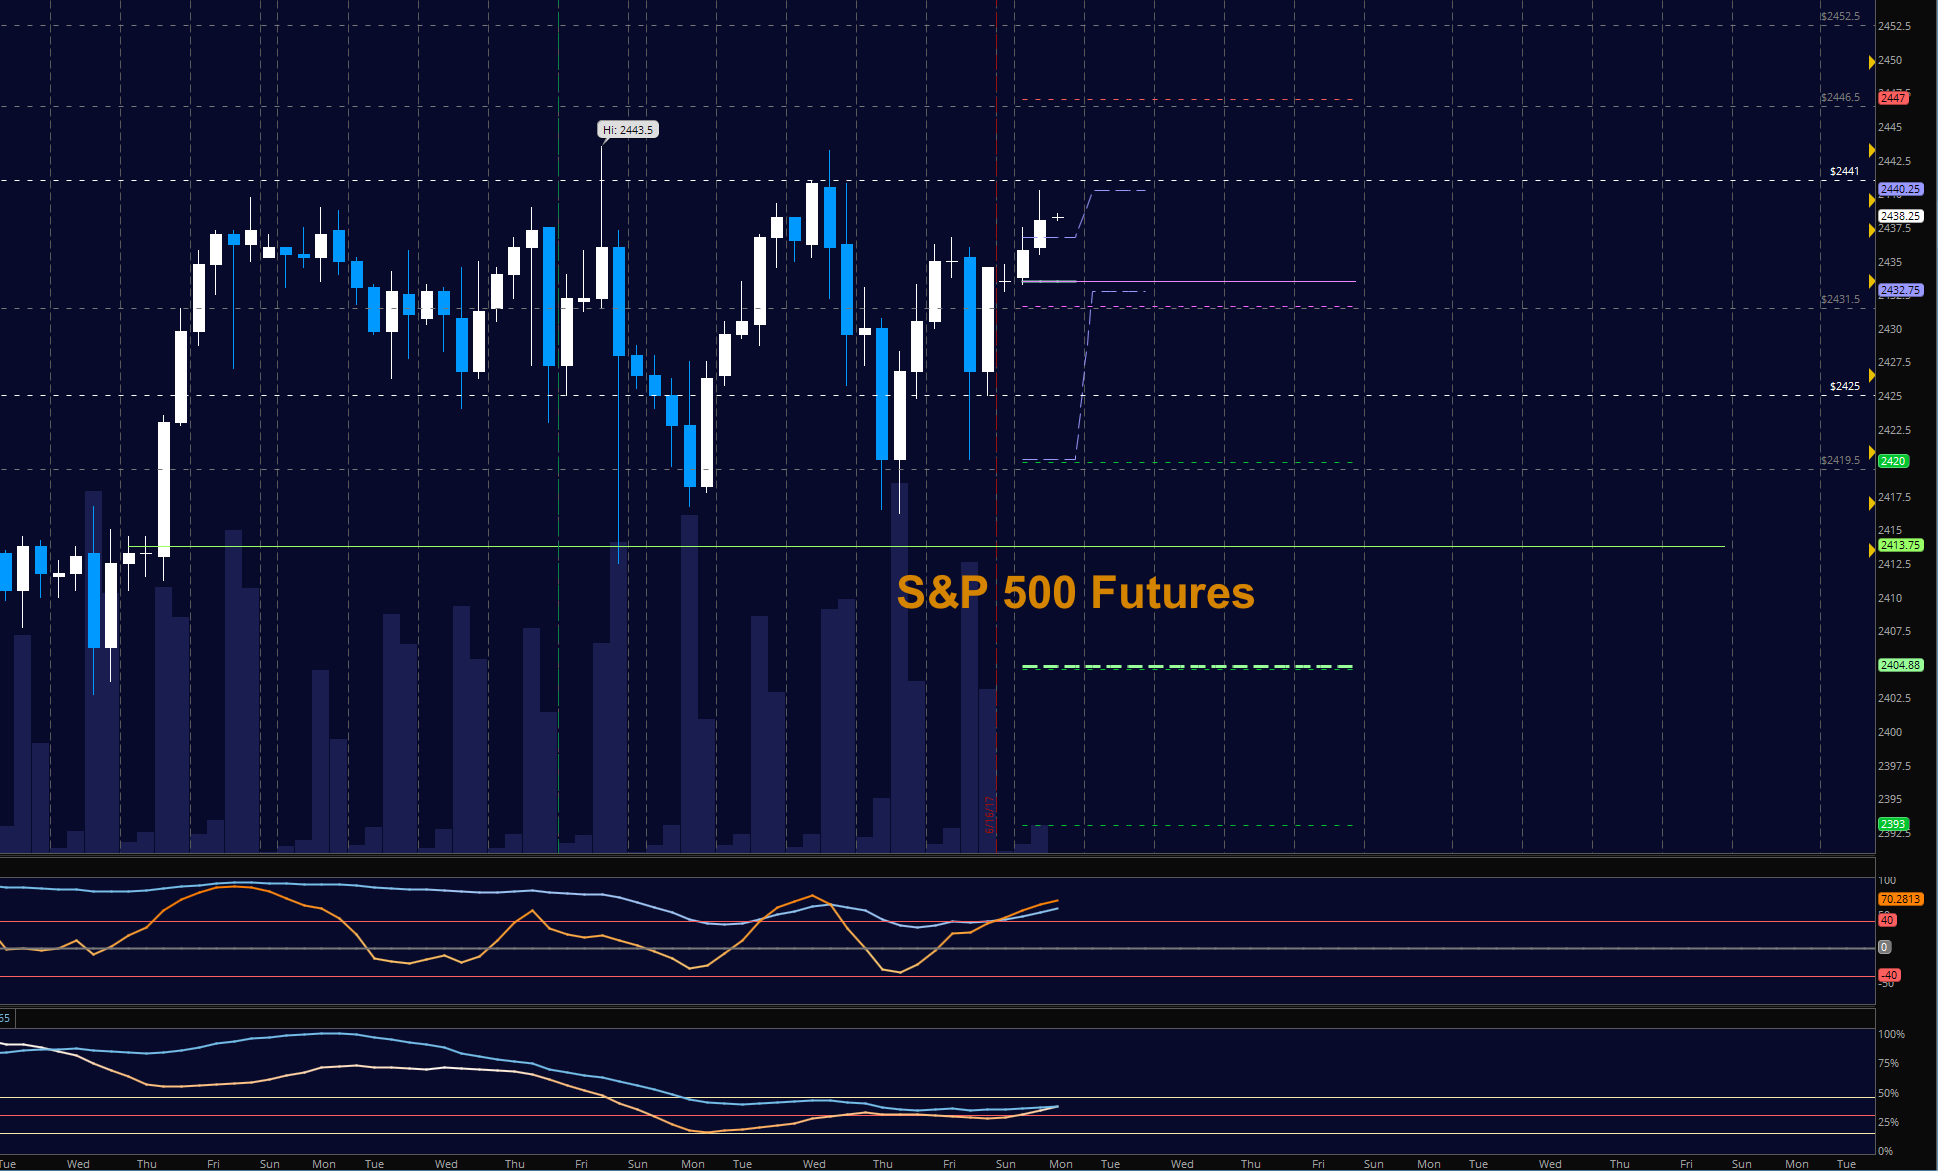
S&P 500 Futures (ES)
A breakout is underway and we should see a fade to higher lows. Price Support intraday has shifted up to 2425. The bullets below represent the likely shift of trading momentum at the positive or failed retests at the levels noted.
- Buying pressure intraday will likely strengthen above a positive retest of 2440.5
- Selling pressure intraday will likely strengthen with a failed retest of 2426
- Resistance sits near 2440.5 to 2443.75, with 2447.75 and 2452.5 above that
- Support holds between 2426.5 and 2422.25, with 2416.75 and 2412.5 below that
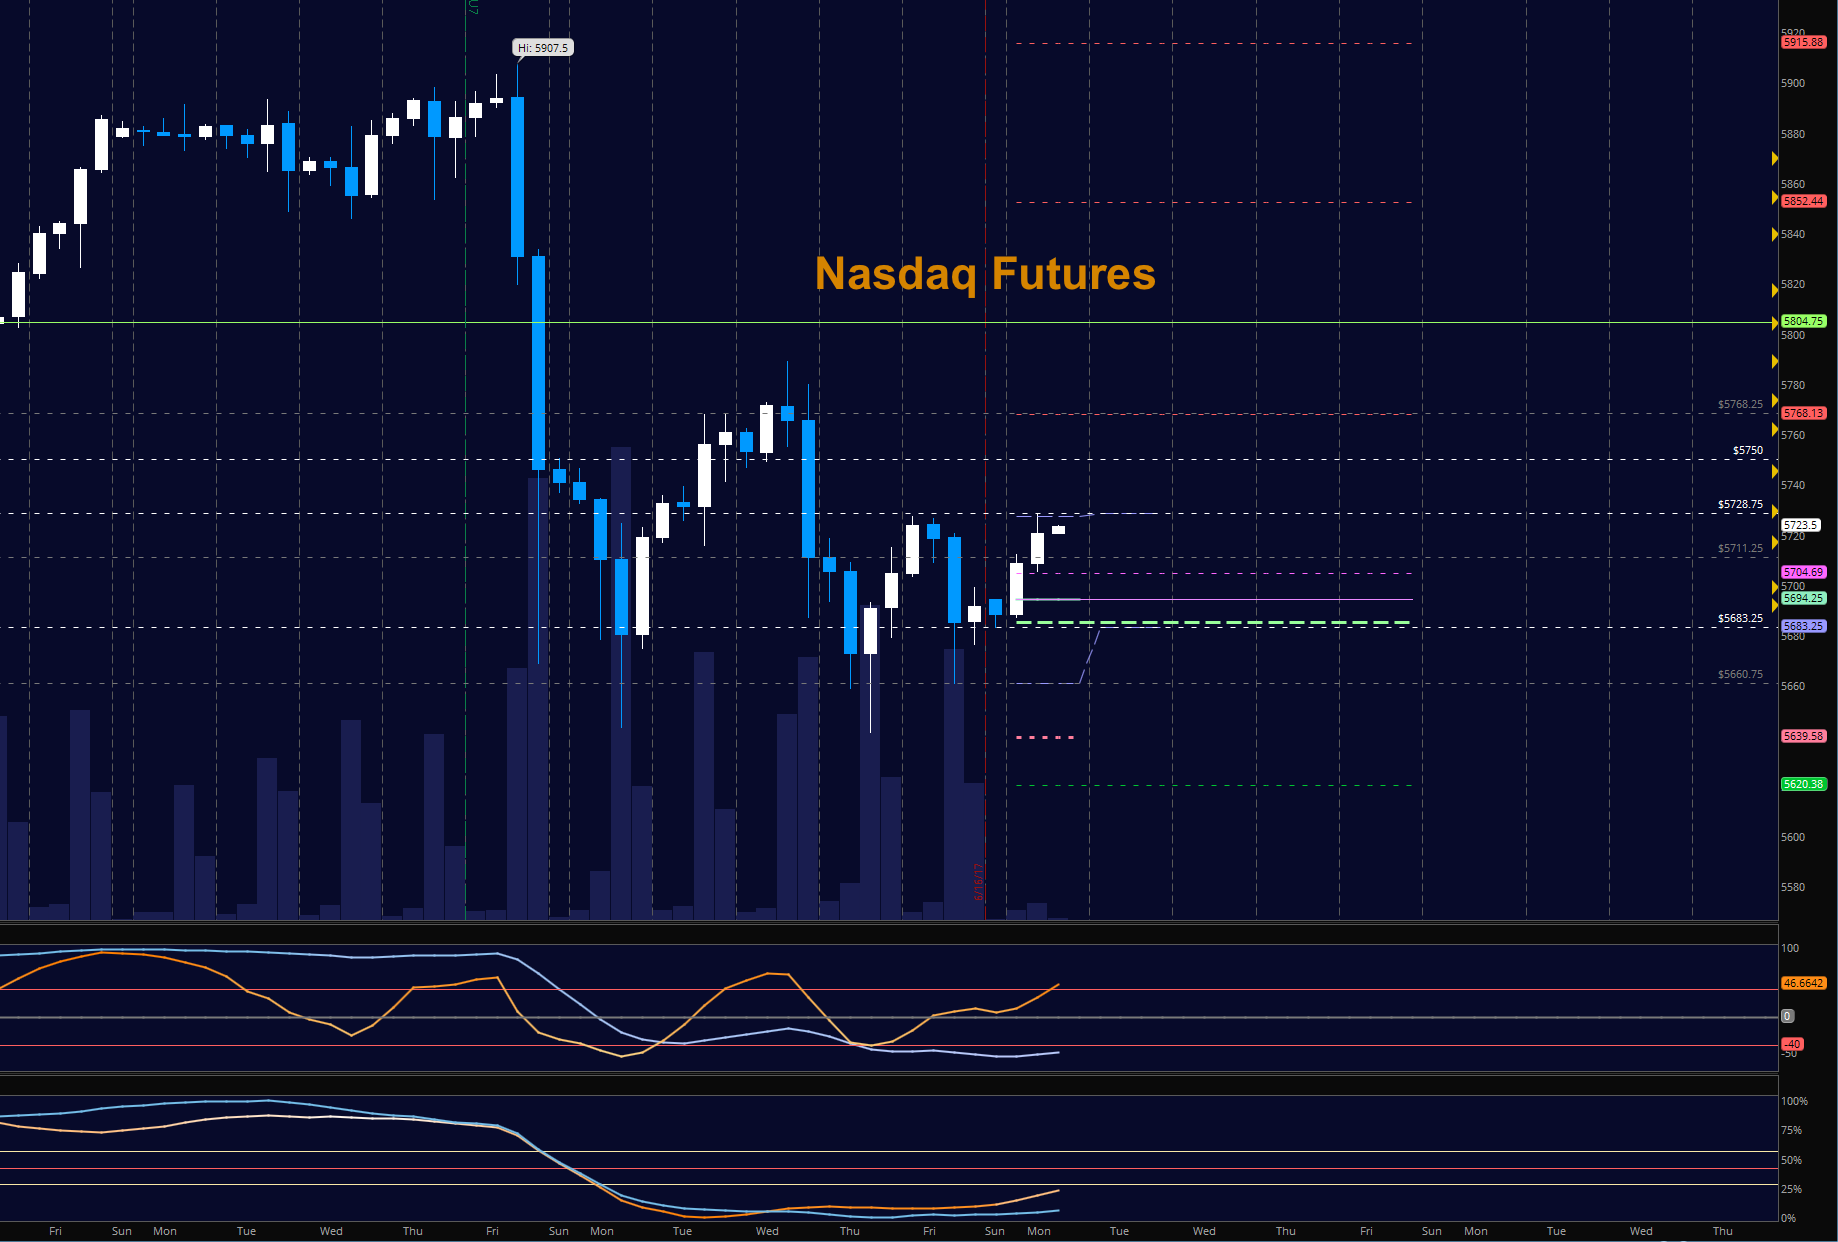
NASDAQ Futures (NQ)
Tech has continued trouble with recovery but is grinding forward into congestion ahead as it makes higher lows. This is a likely reversion to the mean event as tech has outperformed for several months. The NQ now sits near resistance at 5724.75 as it did on Friday’s open. I suspect we breach the area, but the positive retest will make for a better trade if looking to go long on the recovery. Above 5728, charts will hold a bullish slant into 5746, then 5766, but breakouts are not wise to chase unless going after near term targets or using a very wide stop. Support sits near 5704. The bullets below represent the likely shift of intraday trading momentum at the positive or failed tests at the levels noted.
- Buying pressure intraday will likely strengthen with a positive retest of 5728.75
- Selling pressure intraday will likely strengthen with a failed retest of 5694.25
- Resistance sits near 5728.75 to 5732.75, with 5746.5 and 5768.5 above that
- Support holds between 5704.25 and 5694.5, with 5683.25 and 5660.75 below that
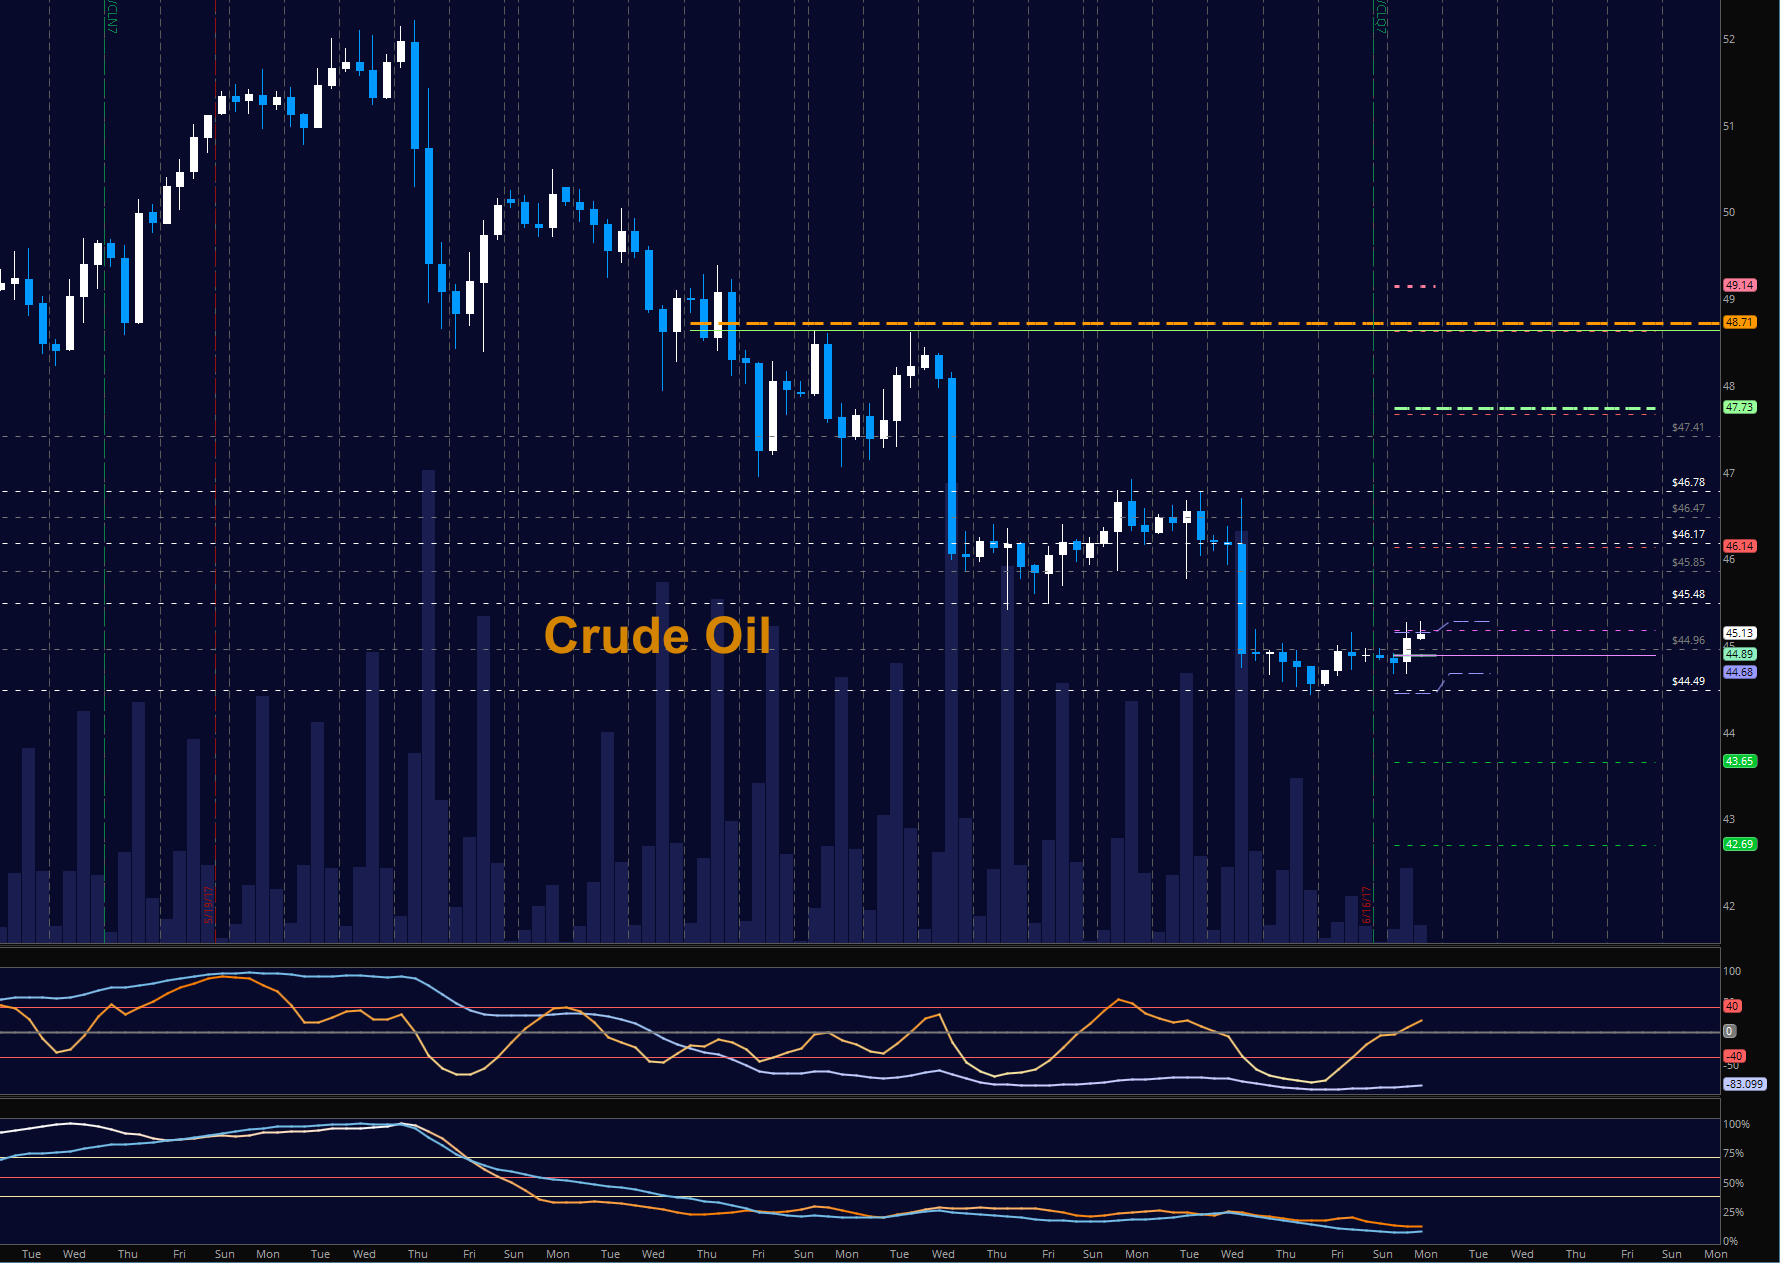
WTI Crude Oil
Hedge funds have increased their net long positions in the coming week, suggesting bounces into resistance will create selling opportunities. A Fibonacci formation projects a fade into 41 or so, but it is much better to short at resistance rather than exposure capital to risk events that are clearly visible. We sit below key resistance near 45.48. Buyers are likely to try to stage a move into 45.7 and possibly 45.96, but that should not give rise to more buying, only allow trapped longs to escape relatively unscathed. The bullets below represent the likely shift of trading momentum at the positive or failed tests at the levels noted.
- Buying pressure intraday will likely strengthen with a positive retest of 46.14
- Selling pressure intraday will strengthen with a failed retest of 44.3
- Resistance sits near 46.14 to 46.74, with 47.15 and 47.4 above that
- Support holds between 44.3 to 44.17, with 43.65 and 43.07 below that.
Our live trading room is now primarily stock market futures content, though we do track heavily traded stocks and their likely daily trajectories as well – we begin at 9am with a morning report and likely chart movements along with trade setups for the day.
As long as the trader keeps himself aware of support and resistance levels, risk can be very adequately managed to play in either direction as bottom picking remains a behavior pattern that is developing with value buyers and speculative traders.
Twitter: @AnneMarieTrades
The author trades stock market futures every day and may have a position in mentioned securities at the time of publication. Any opinions expressed herein are solely those of the author, and do not in any way represent the views or opinions of any other person or entity.

: Creating Bullish Divergence?")

: Creating Bullish Divergence?")


