Stock Market Futures Trading Considerations For July 27, 2017
The S&P 500 Index (INDEXSP:.INX) is pushing into that upper resistance zone again this morning. Buyers will have to chew through a few areas of resistance before making any serious headway. Key futures trading levels and analysis for the S&P 500, Nasdaq, and crude oil are below.
Check out today’s economic calendar with a full rundown of releases. And note that the charts below are from our premium service and shared exclusively with See It Market readers.
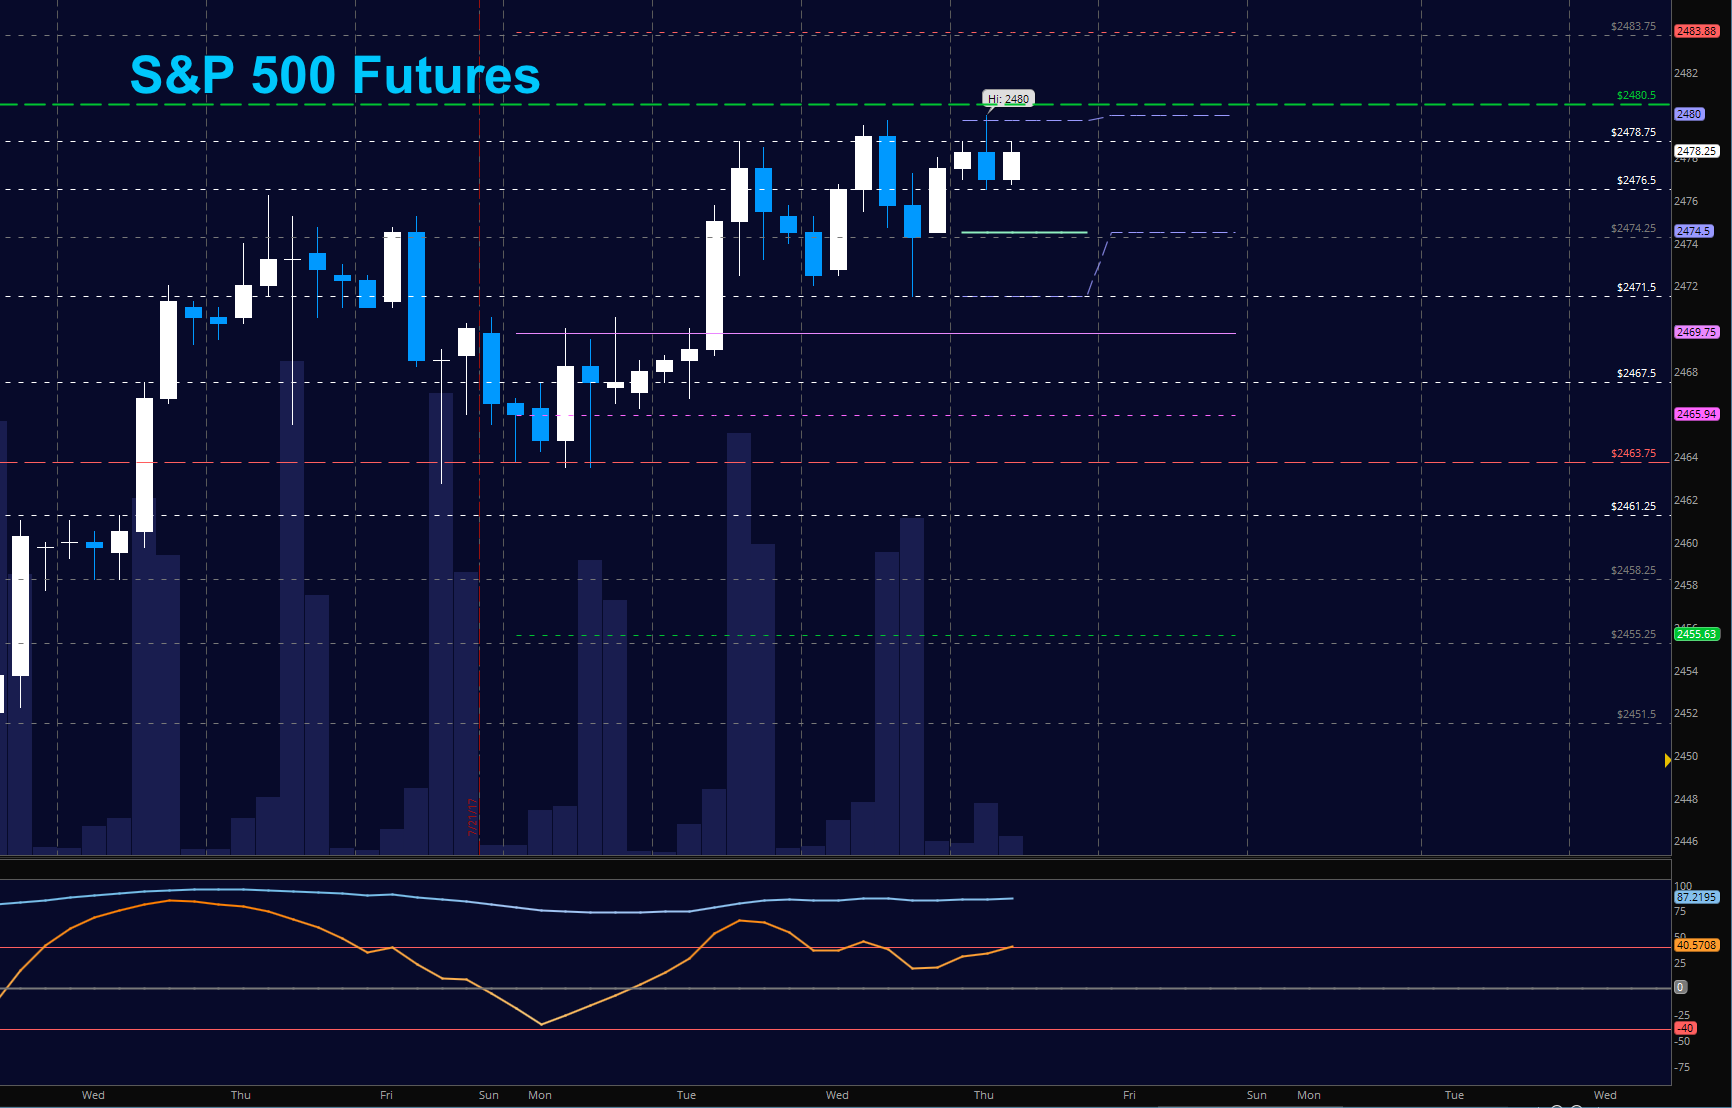
S&P 500 Futures (ES)
New highs in the early market hours as earnings continue to be released. Support to hold today to keep the intraday bullish slant will be 2472 with 2470 below that – the same levels for yesterday. Resistance now sits at Fibonacci extensions at 2480.5. The bullets below represent the likely shift of trading momentum at the positive or failed retests at the levels noted.
- Buying pressure intradaywill likely strengthen above a positive retest of 2478.75 (careful again here with resistance)
- Sellingpressure intraday will likely strengthen with a failed retest of 2470
- Resistance sits near 2480.5 to 2483.5, with 2484.75 and 2486.75 above that.
- Support holds between 2471.5 and 2467.5, with 2463.5 and 2457.5 below that.
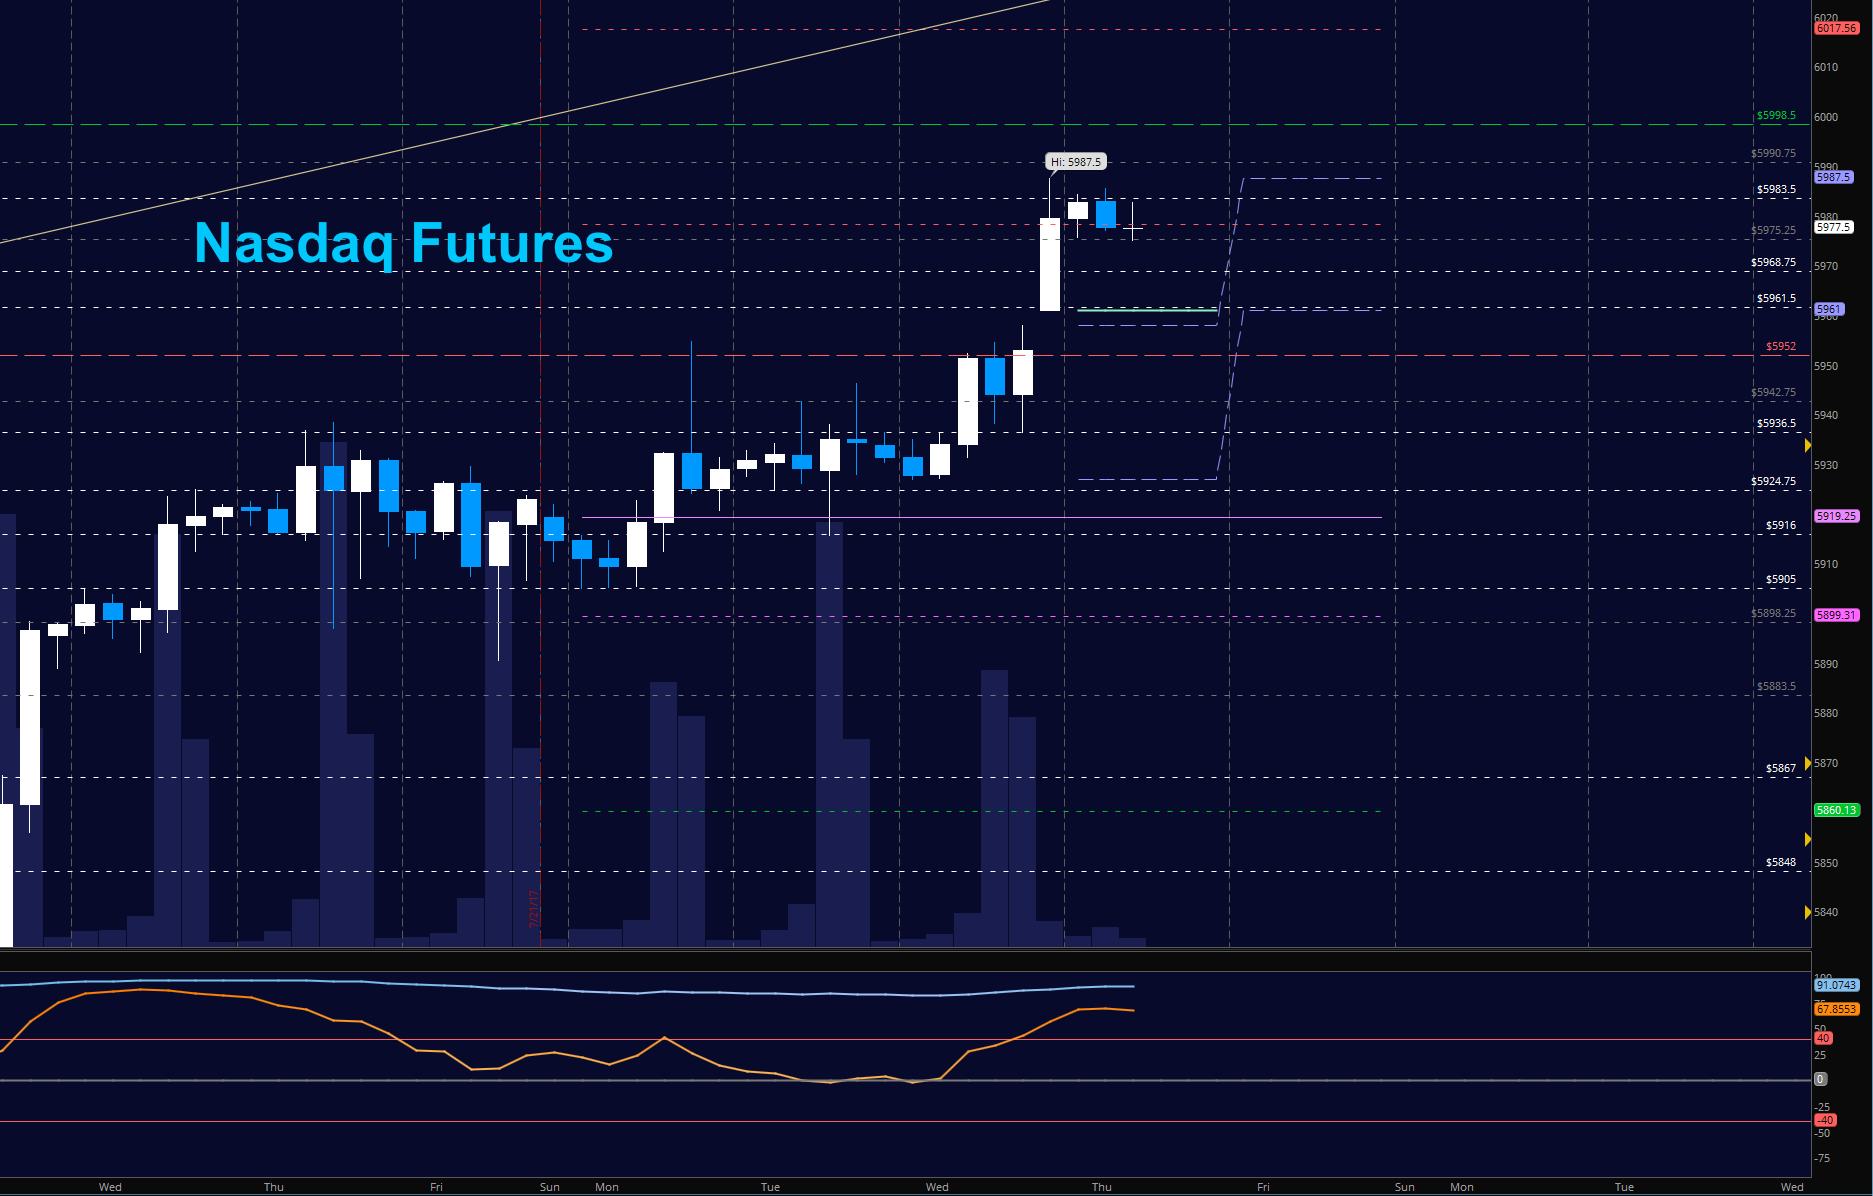
NASDAQ Futures (NQ)
Another large move up pre-market today with a brand new high wait for participating traders at the open. Momentum holds steady, but formations still suggest that breakouts are likely to fade into higher lows. We have a gap today so that may come into play. The bullets below represent the likely shift of intraday trading momentum at the positive or failed tests at the levels noted.
- Buyingpressure intraday will likely strengthen with a positive retest of 5975.5
- Sellingpressure intraday will likely strengthen with a failed retest of 5961
- Resistance sits near 5975.5 to 5987.5, with 5990.75 and 5998.75 above that.
- Support holds between 5960.75 and 5952.5, with 5946.5 and 5938.5 below that.
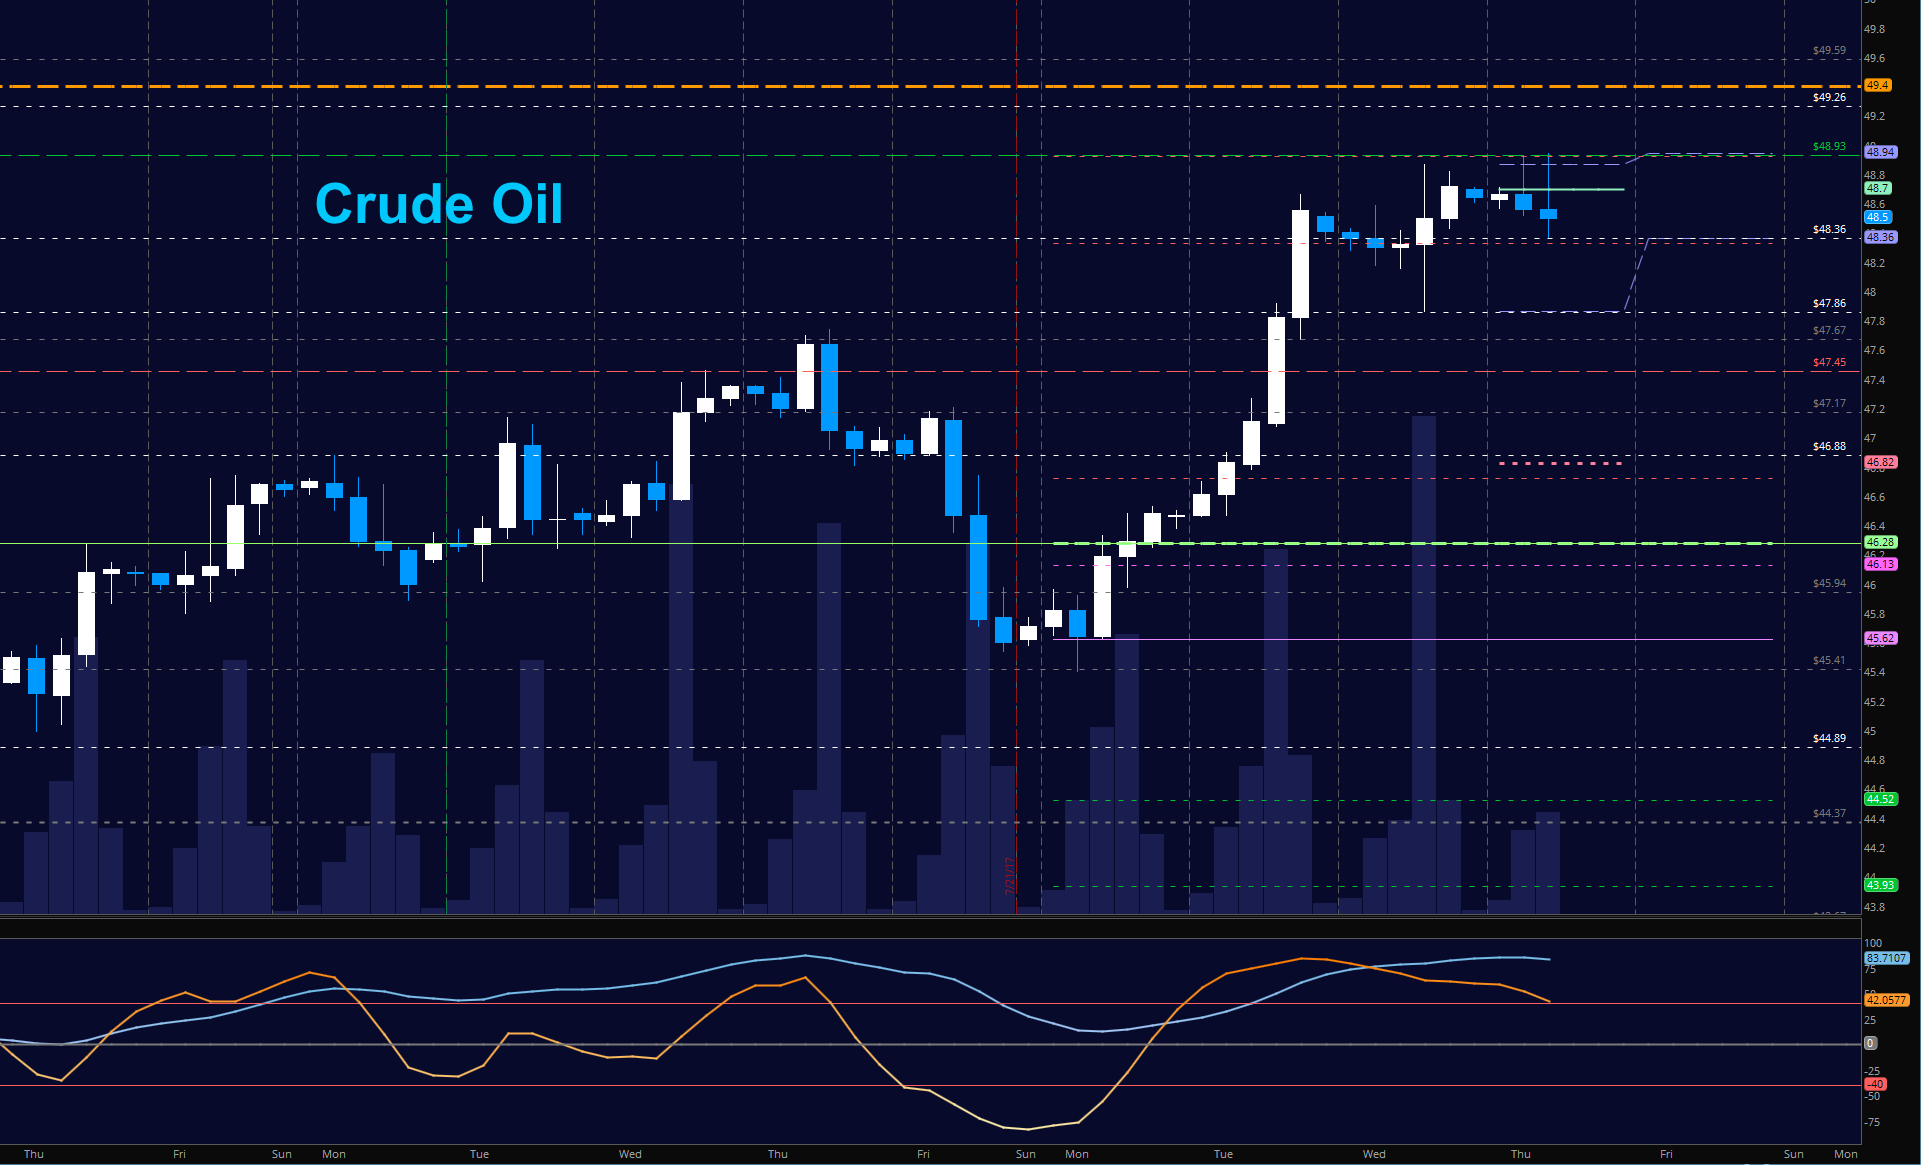
WTI Crude Oil
As this chart comes into targets seen from old resistance and Fibonacci extensions of current waves, traders are stalled in the breakout regions near 48.36. Momentum is still bullish and pullbacks will continue to hold regions for buyers to engage, but our dips could be a bit deeper so watch for support regions to hold if you are overly bullish. Support levels near 48 should quickly recover in a bullish setting today. Above 48.88, we see 49.26 to 49.59 as the next test area. The bullets below represent the likely shift of trading momentum at the positive or failed tests at the levels noted.
- Buyingpressure intraday will likely strengthen with a positive retest of 48.89
- Sellingpressure intraday will strengthen with a failed retest of 47.96
- Resistance sits near 48.89 to 49.26, with 49.59 and 49.78 above that.
- Support holds between 48.01 to 47.86, with 47.45 and 46.88 below that.
If you’re interested in the live trading room, it is now primarily stock market futures content, though we do track heavily traded stocks and their likely daily trajectories as well – we begin at 9am with a morning report and likely chart movements along with trade setups for the day.
As long as the trader keeps himself aware of support and resistance levels, risk can be very adequately managed to play in either direction as bottom picking remains a behavior pattern that is developing with value buyers and speculative traders.
Twitter: @AnneMarieTrades
The author trades stock market futures every day and may have a position in mentioned securities at the time of publication. Any opinions expressed herein are solely those of the author, and do not in any way represent the views or opinions of any other person or entity.


