Stock Market Futures Considerations For July 19, 2017
After a brief period of consolidation, the S&P 500 (INDEXSP:.INX) is attempting another move to the upside. On the futures market, 2470.5 looks like resistance. See more trading levels below.
Check out today’s economic calendar with a full rundown of releases. And note that the charts below are from our premium service and shared exclusively with See It Market readers.
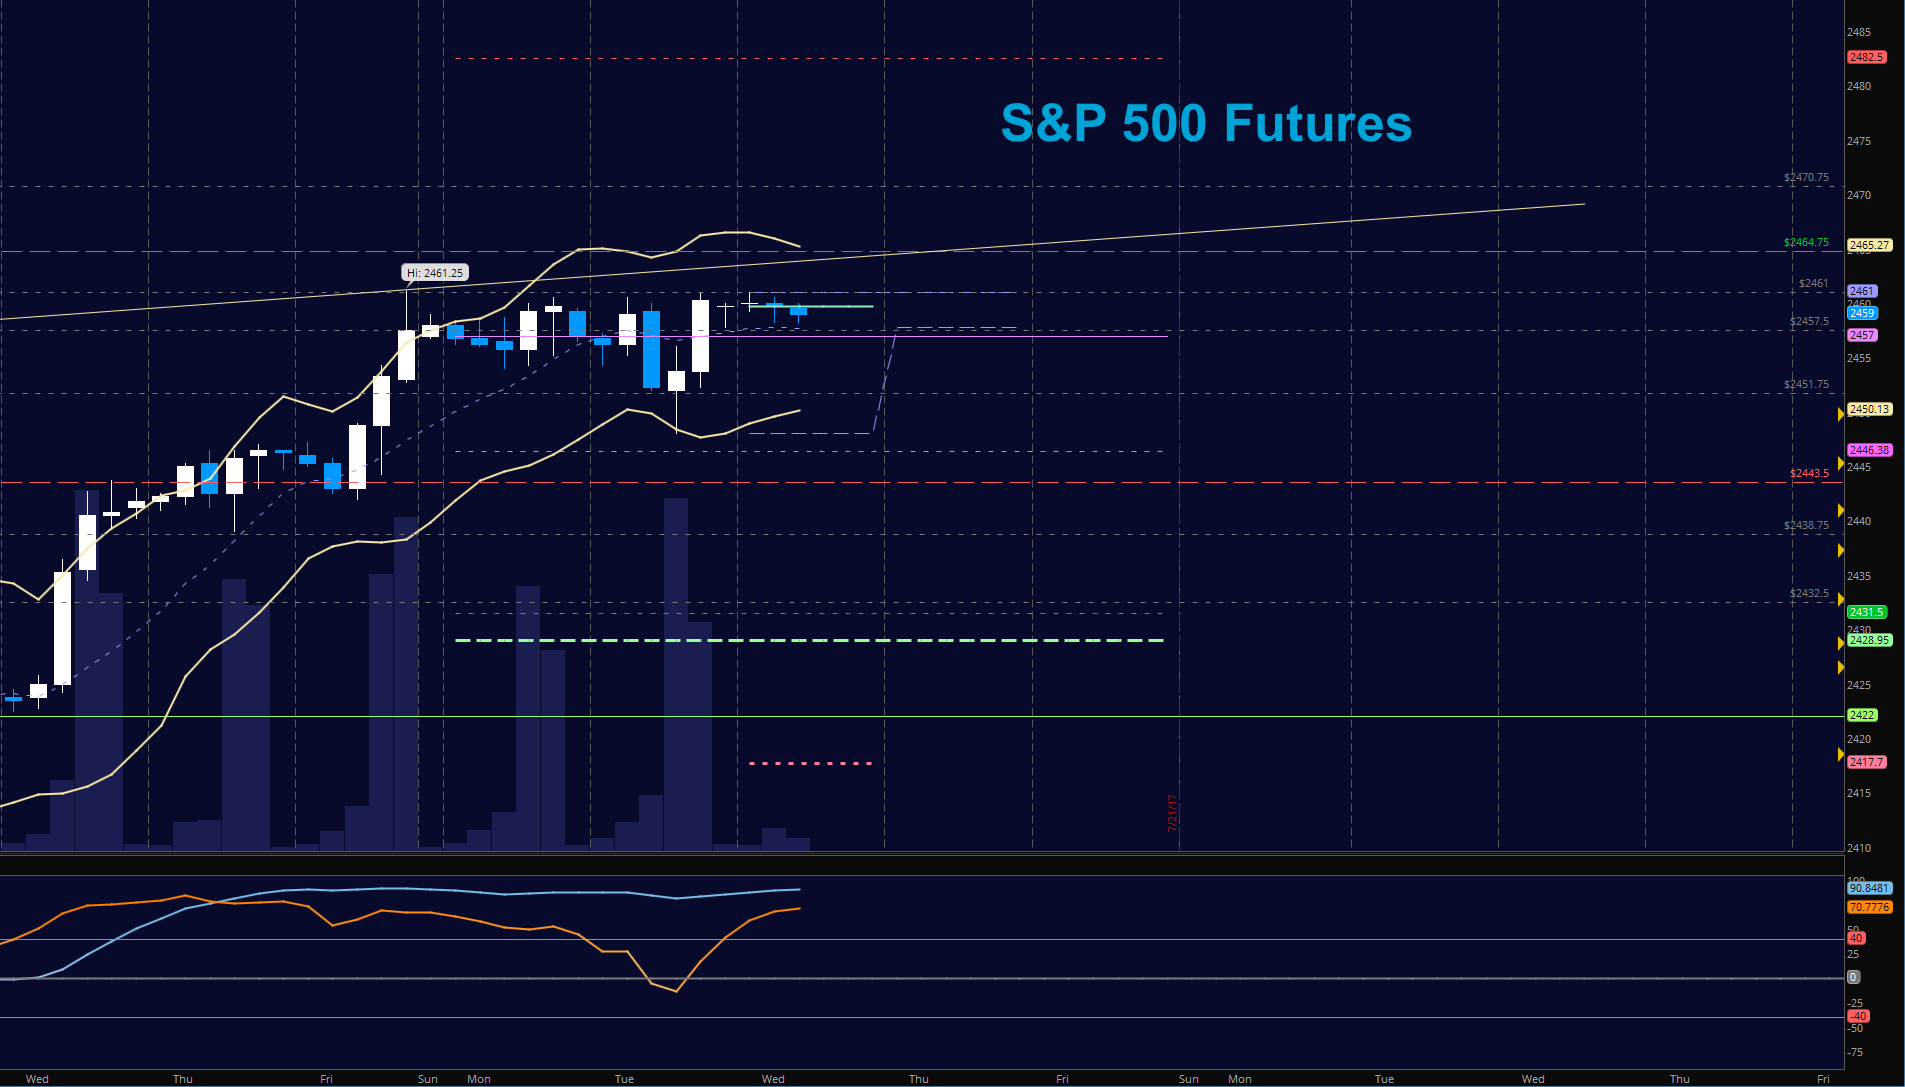
S&P 500 Futures (ES)
We begin the day within a tight range with signals that suggest that pullbacks to areas of support will be met with buyers ready to take advantage of perceived value on the intraday cycle. Range based trading should always hold a cautionary tone in any prevailing undercurrent….and our undercurrent is still bullish on bigger time frames. Resistance presses forward. Support deeps a bit deeper. The bullets below represent the likely shift of trading momentum at the positive or failed retests at the levels noted.
- Buying pressure intraday will likely strengthen above a positive retest of 2461 (careful again here with resistance)
- Selling pressure intraday will likely strengthen with a failed retest of 2450
- Resistance sits near 2460 to 2462.5, with 2464.75 and 2470.5 above that.
- Support holds between 2450.5 and 2447.75, with 2443.25 and 2438.5 below that.
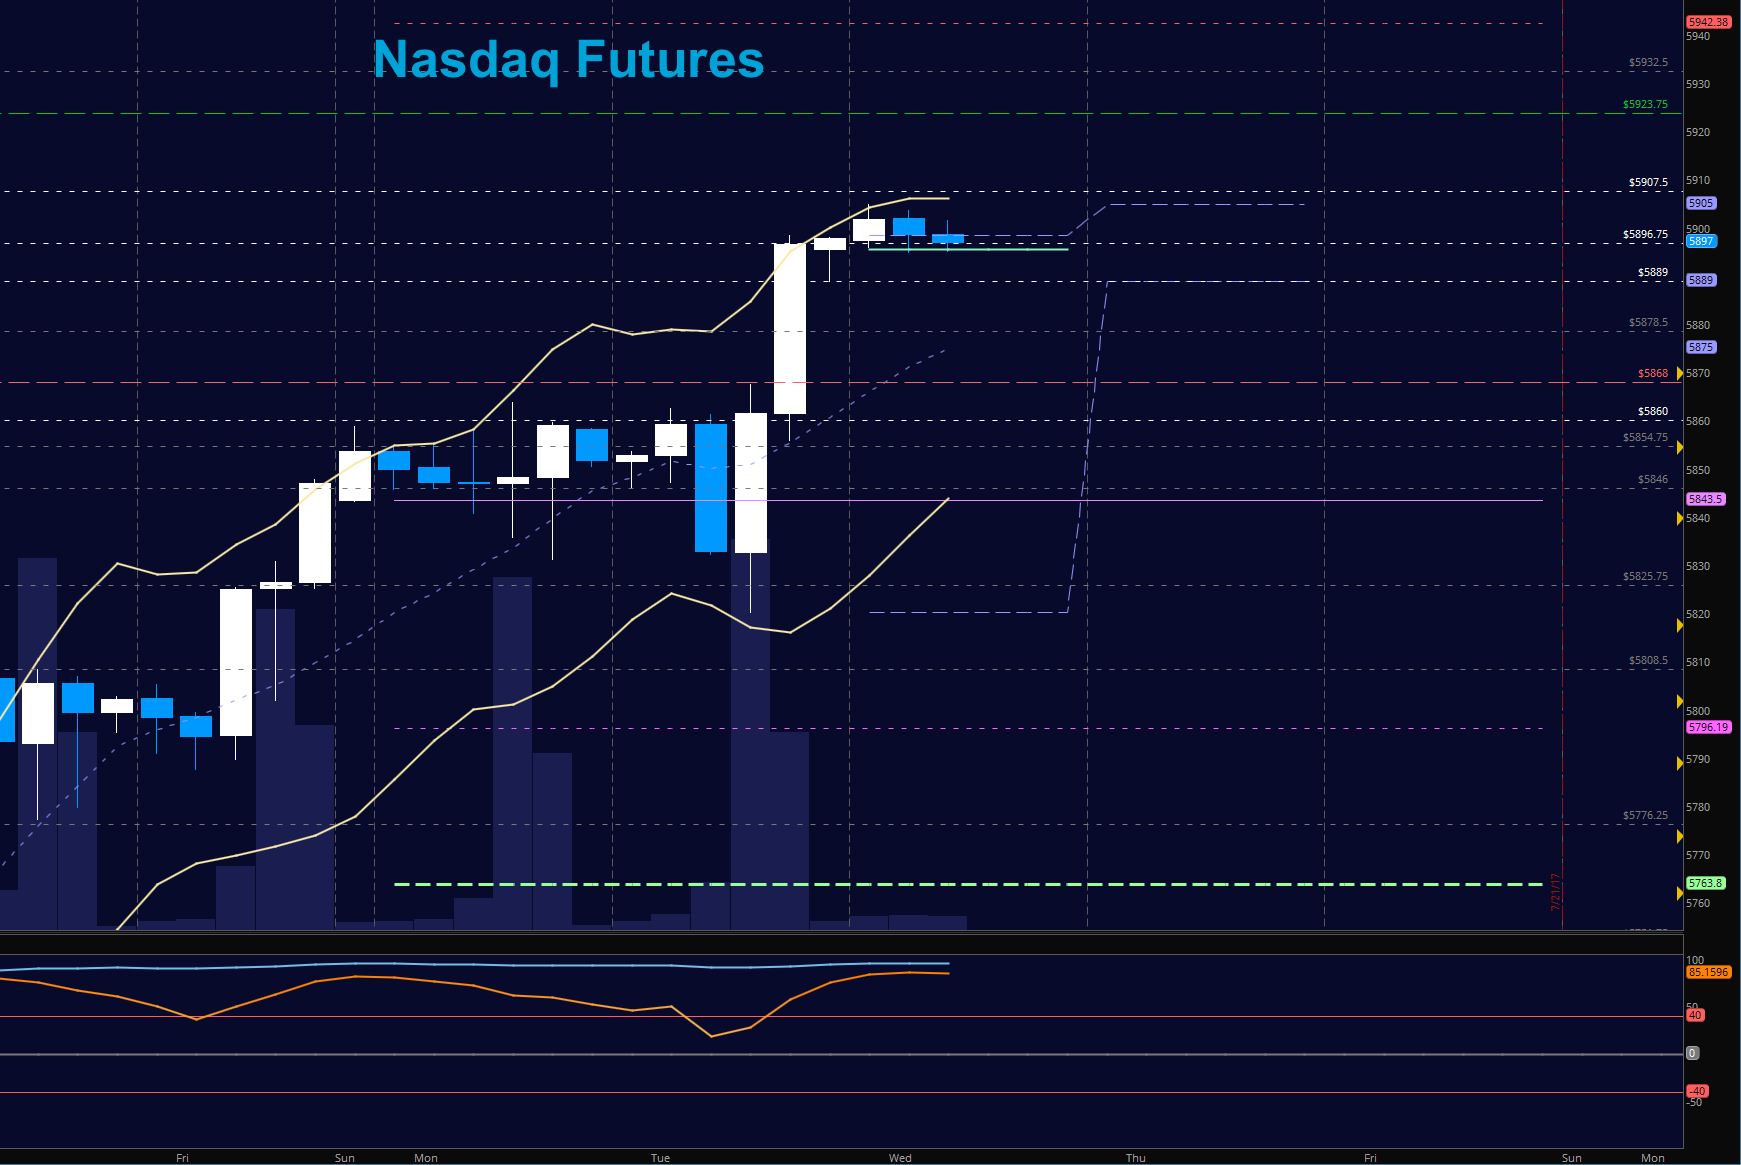
NASDAQ Futures (NQ)
With a sharp bounce off support, traders sent price forward into tests close to all time highs – but just shy. Formations suggest pullbacks will be buy zones, as we moved just past the highest level of resistance mentioned yesterday and we are currently battling at this region of 5896.75. The deep pullbacks continue to present excellent opportunities for the brave. The bullets below represent the likely shift of intraday trading momentum at the positive or failed tests at the levels noted.
- Buying pressure intraday will likely strengthen with a positive retest of 5902.25
- Selling pressure intraday will likely strengthen with a failed retest of 5889
- Resistance sits near 5896.5 to 5907.5, with 5923.75 and 5932.5 above that.
- Support holds between 5889.5 and 5868.5, with 5854.5 and 5820.5 below that.
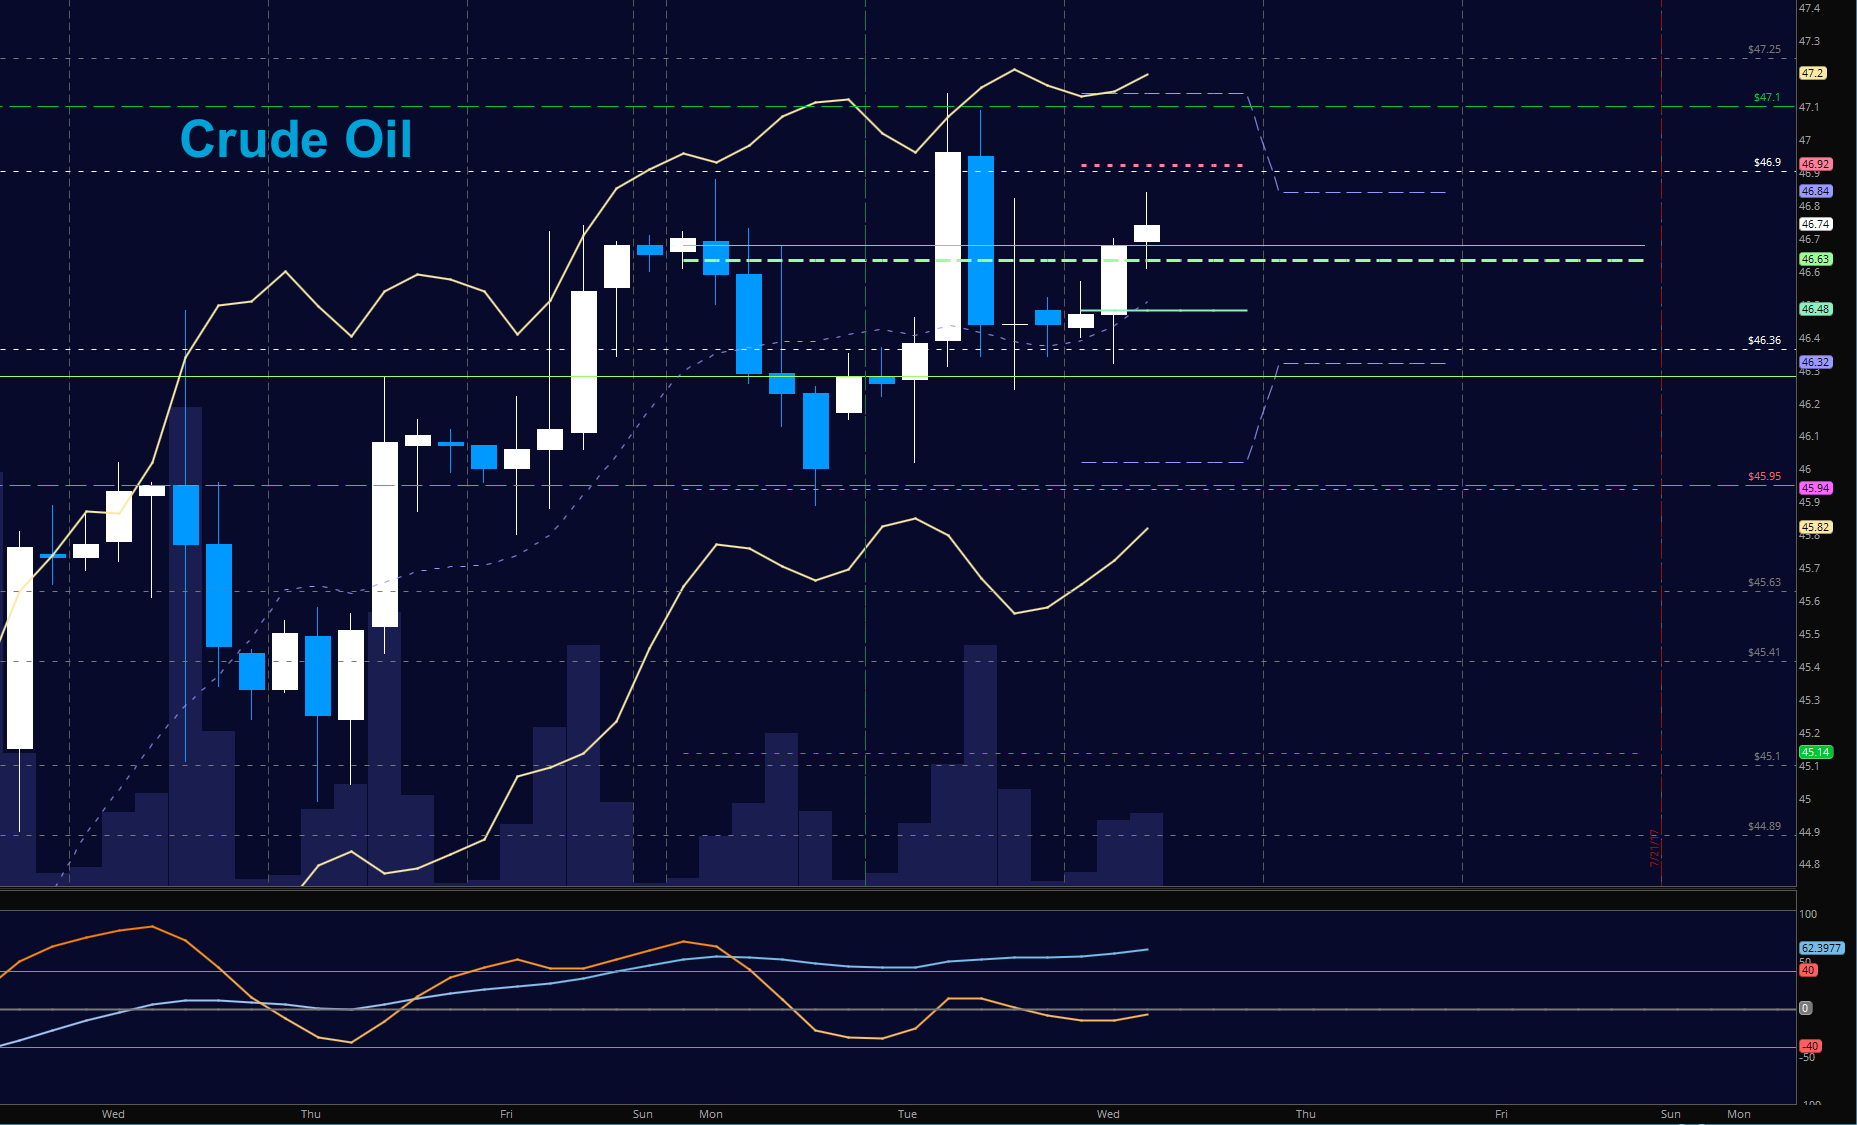
WTI Crude Oil
EIA report ahead – Buyers saved the day yesterday at our familiar level of support near 46.3 and are slowing moving us back into resistance near 46.96. Above positive retests of 47 and we are likely to break out of the very noisy space and into higher resistance. Sellers will win any near-term battles below failed tests of 45.95. Momentum is still flat to slightly upward, suggesting that buyers will find support on the pullbacks. The bullets below represent the likely shift of trading momentum at the positive or failed tests at the levels noted.
- Buying pressure intraday will likely strengthen with a positive retest of 47.1(careful -resistance ahead)
- Selling pressure intraday will strengthen with a failed retest of 46.2
- Resistance sits near 46.96 to 47.23, with 47.88 and 48.23 above that.
- Support holds between 46.32 to 45.95, with 45.66 and 45.15 below that.
If you’re interested in the live trading room, it is now primarily stock market futures content, though we do track heavily traded stocks and their likely daily trajectories as well – we begin at 9am with a morning report and likely chart movements along with trade setups for the day.
As long as the trader keeps himself aware of support and resistance levels, risk can be very adequately managed to play in either direction as bottom picking remains a behavior pattern that is developing with value buyers and speculative traders.
Twitter: @AnneMarieTrades
The author trades stock market futures every day and may have a position in mentioned securities at the time of publication. Any opinions expressed herein are solely those of the author, and do not in any way represent the views or opinions of any other person or entity.


