Stock Market Considerations For September 25, 2017
The S&P 500 (NYSEARCA:SPY) is headed for a lower start to Monday’s trading session. Below I take a look at key futures trading levels for the S&P 500, Nasdaq, and crude oil.
Check out today’s economic calendar with a full rundown of releases. And note that the charts below are from our premium service and shared exclusively with See It Market readers.
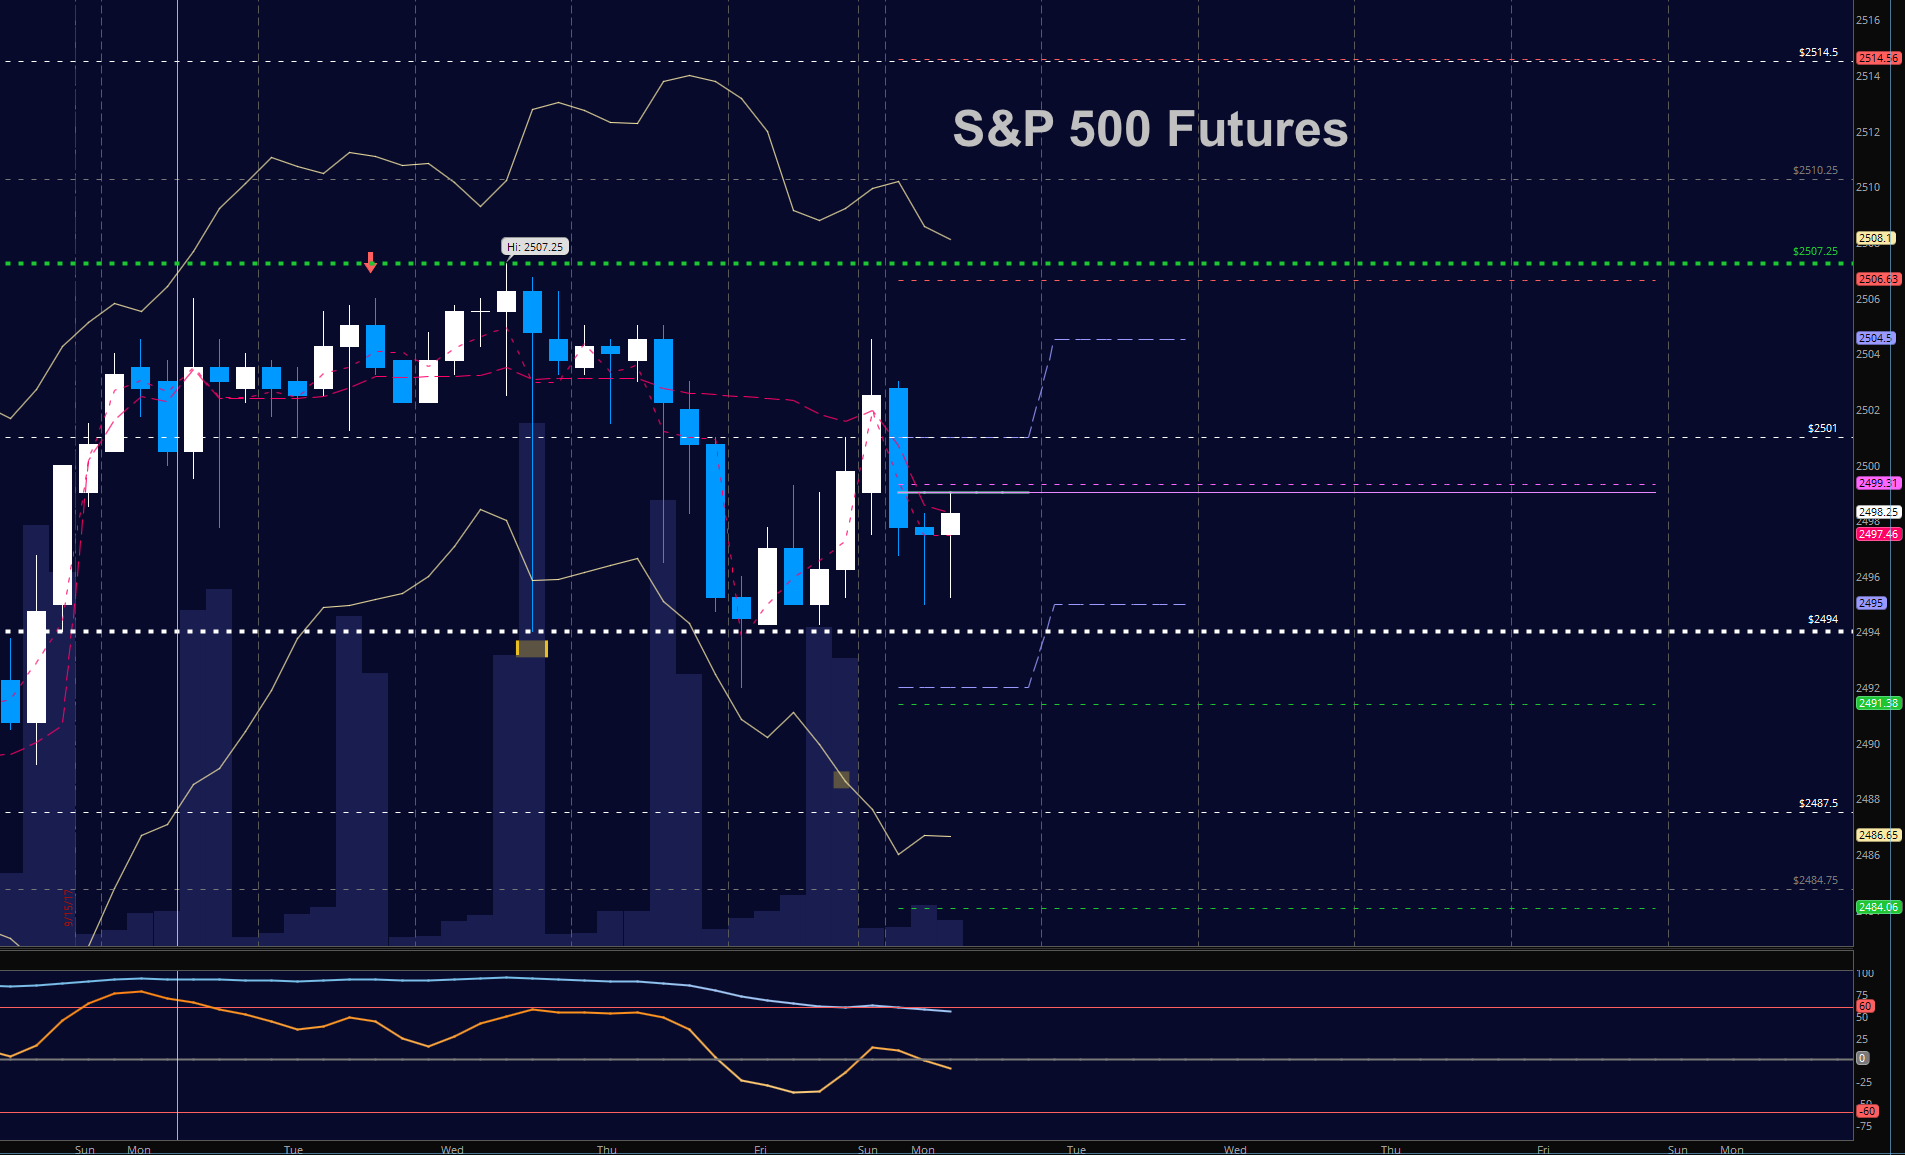
S&P 500 Futures (ES)
Congested behavior but bouncing into resistance. Support action holds at 2492 Resistance action holds near 2507 today. The bullets below represent the likely shift of trading momentum at the positive or failed retests at the levels noted.
- Buying pressure intraday will likely strengthen above a positive retest of 2504.
- Selling pressure intraday will likely strengthen with a failed retest of 2492.
- Resistance sits near 2503.75 to 2507.5, with 2511.5 and 2519.5 above that.
- Support holds between 2492.5 and 2487.5, with 2484.5 and 2479.5 below that.
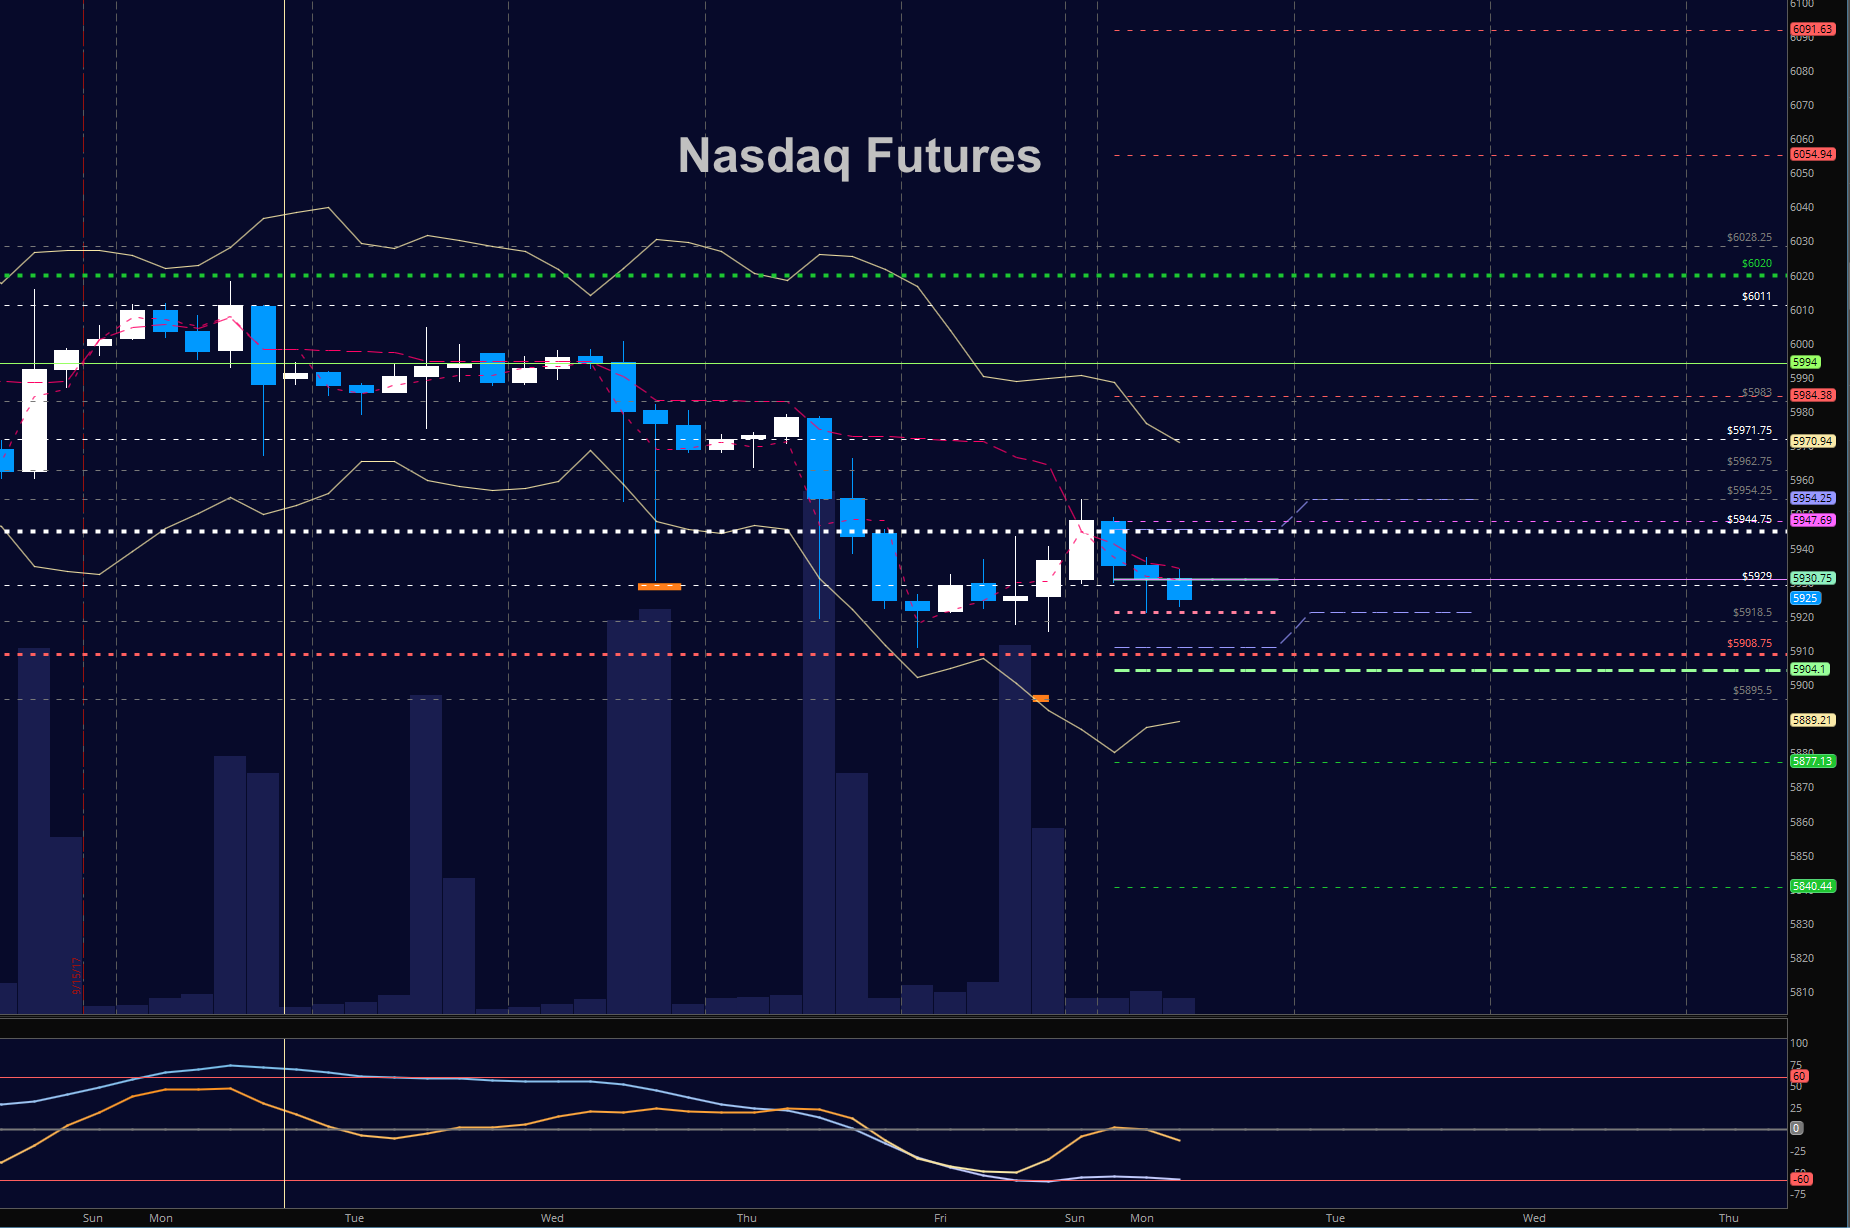
NASDAQ Futures (NQ)
Momentum is mixed with lower highs continuing. Range bound behavior between 5920.5 and 5966. The bullets below represent the likely shift of intraday trading momentum at the positive or failed tests at the levels noted.
- Buying pressure intraday will likely strengthen with a positive retest of 5954.
- Selling pressure intraday will likely strengthen with a failed retest of 5918.
- Resistance sits near 5963 to 5971.25, with 5983.25 and 5990.5 above that.
- Support holds between 5944.25 and 5924.5, with 5918 and 5896.5 below that.
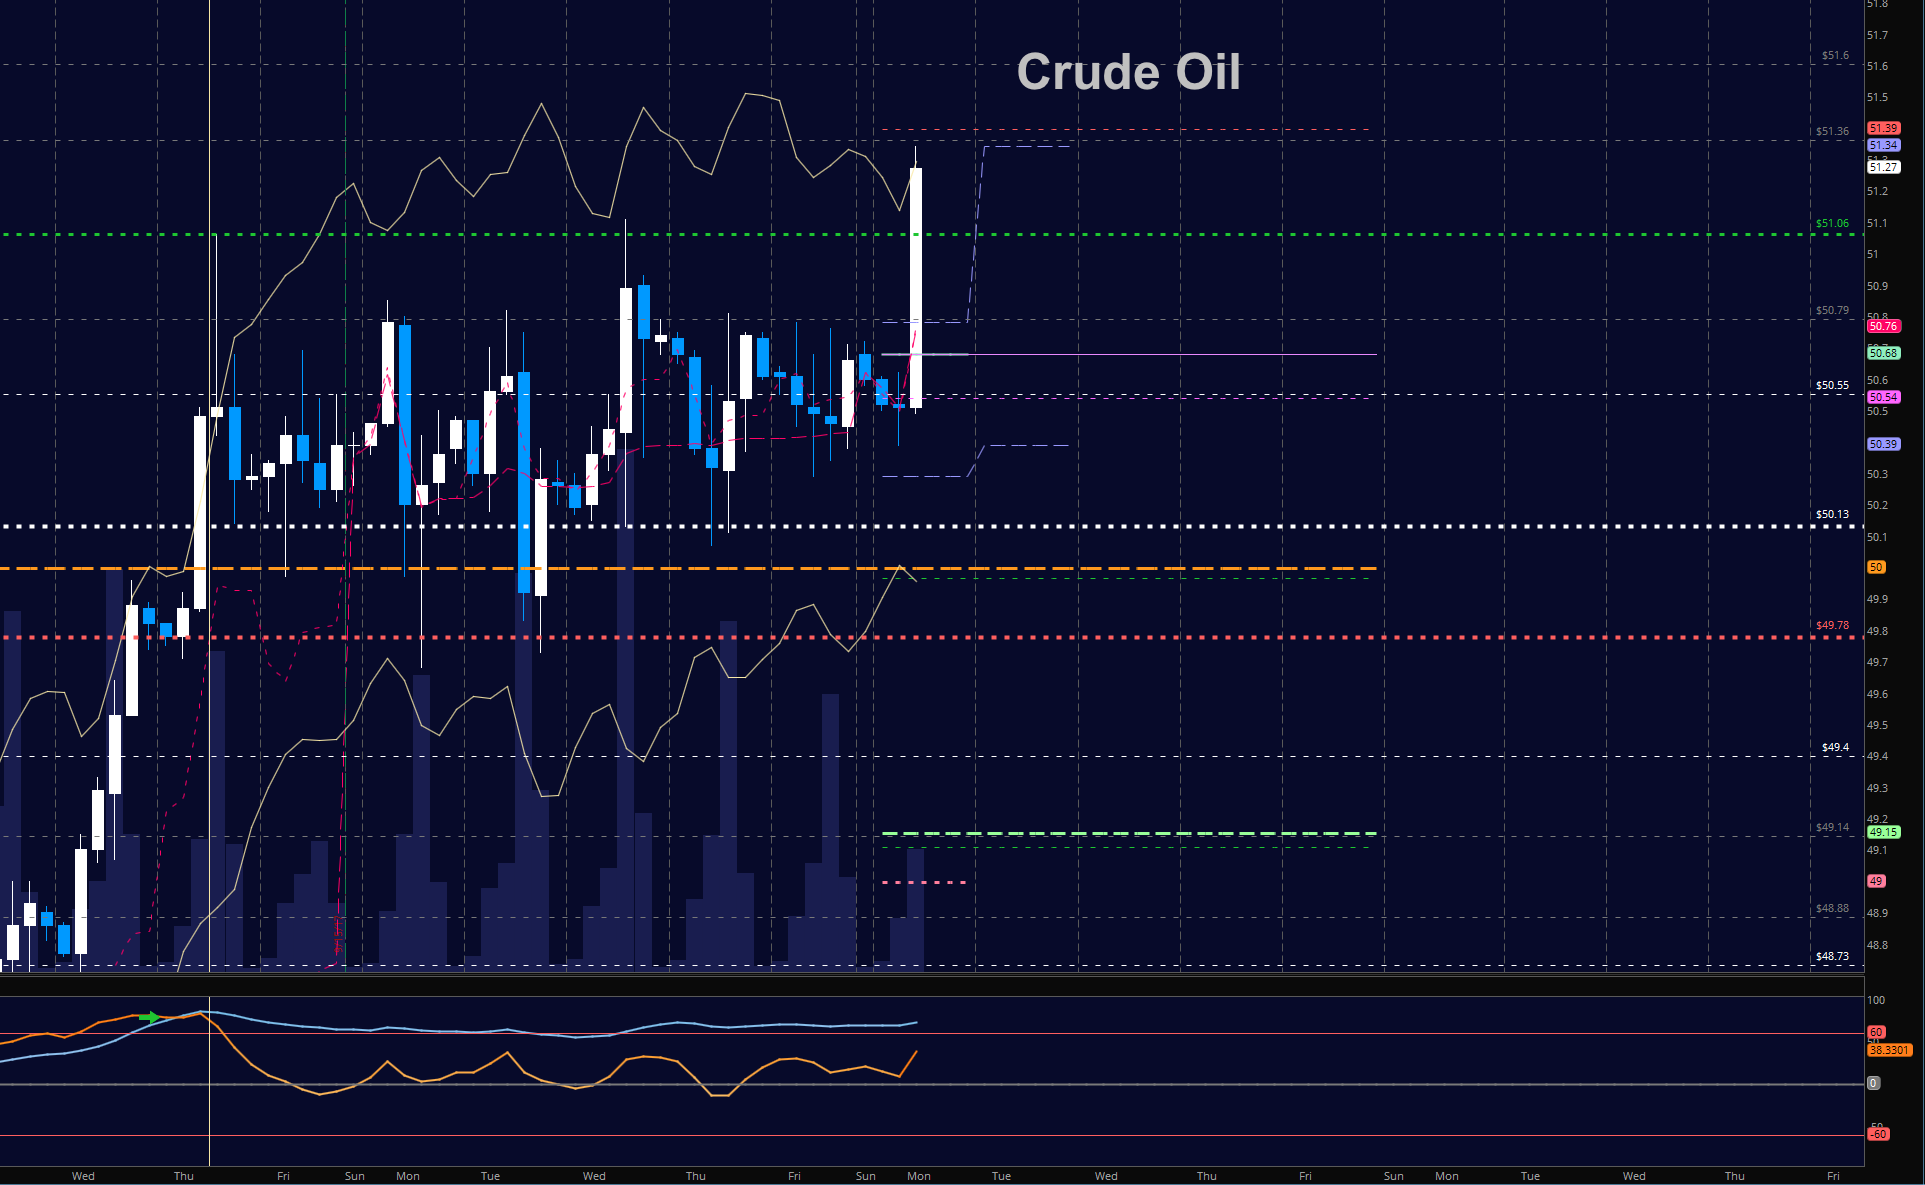
WTI Crude Oil
Chart is very rangebound. Buyers will have the upper hand as long as we hold 50.89. The bullets below represent the likely shift of trading momentum at the positive or failed tests at the levels noted.
- Buying pressure intraday will likely strengthen with a positive retest of 50.89.
- Selling pressure intraday will strengthen with a failed retest of 49.50.
- Resistance sits near 50.79 to 51.1, with 51.4 and 51.97 above that.
- Support holds between 49.54 to 49.15, with 48.87 and 48.5 below that.
If you’re interested in watching these trades go live, join us in the live trading room from 9am to 11:30am each trading day. Visit TheTradingBook for more information.
If you’re interested in the live trading room, it is now primarily stock market futures content, though we do track heavily traded stocks and their likely daily trajectories as well – we begin at 9am with a morning report and likely chart movements along with trade setups for the day.
As long as the trader keeps himself aware of support and resistance levels, risk can be very adequately managed to play in either direction as bottom picking remains a behavior pattern that is developing with value buyers and speculative traders.
Twitter: @AnneMarieTrades
The author trades stock market futures every day and may have a position in mentioned securities at the time of publication. Any opinions expressed herein are solely those of the author, and do not in any way represent the views or opinions of any other person or entity.


