Stock Market Futures Trading Outlook for October 6, 2016 –
The “wedge” pattern noted on the S&P 500 futures chart below is the pattern I have chosen to watch. We show tightening ranges, that when broken quickly recover. Price support on S&P 500 futures currently holds at 2140. And sellers have piled up near 2155.75, which represents new price resistance. The breakout level remains 2168. We have a couple of days with economic news that could push the S&P 500 Index (INDEXSP:.INX) either down or up. That said, a true breach and hold in either direction seems unlikely this week.
See today’s economic calendar with a rundown of releases.
TODAY’S RANGE OF MOTION
S&P 500 Futures Trading Outlook For October 6
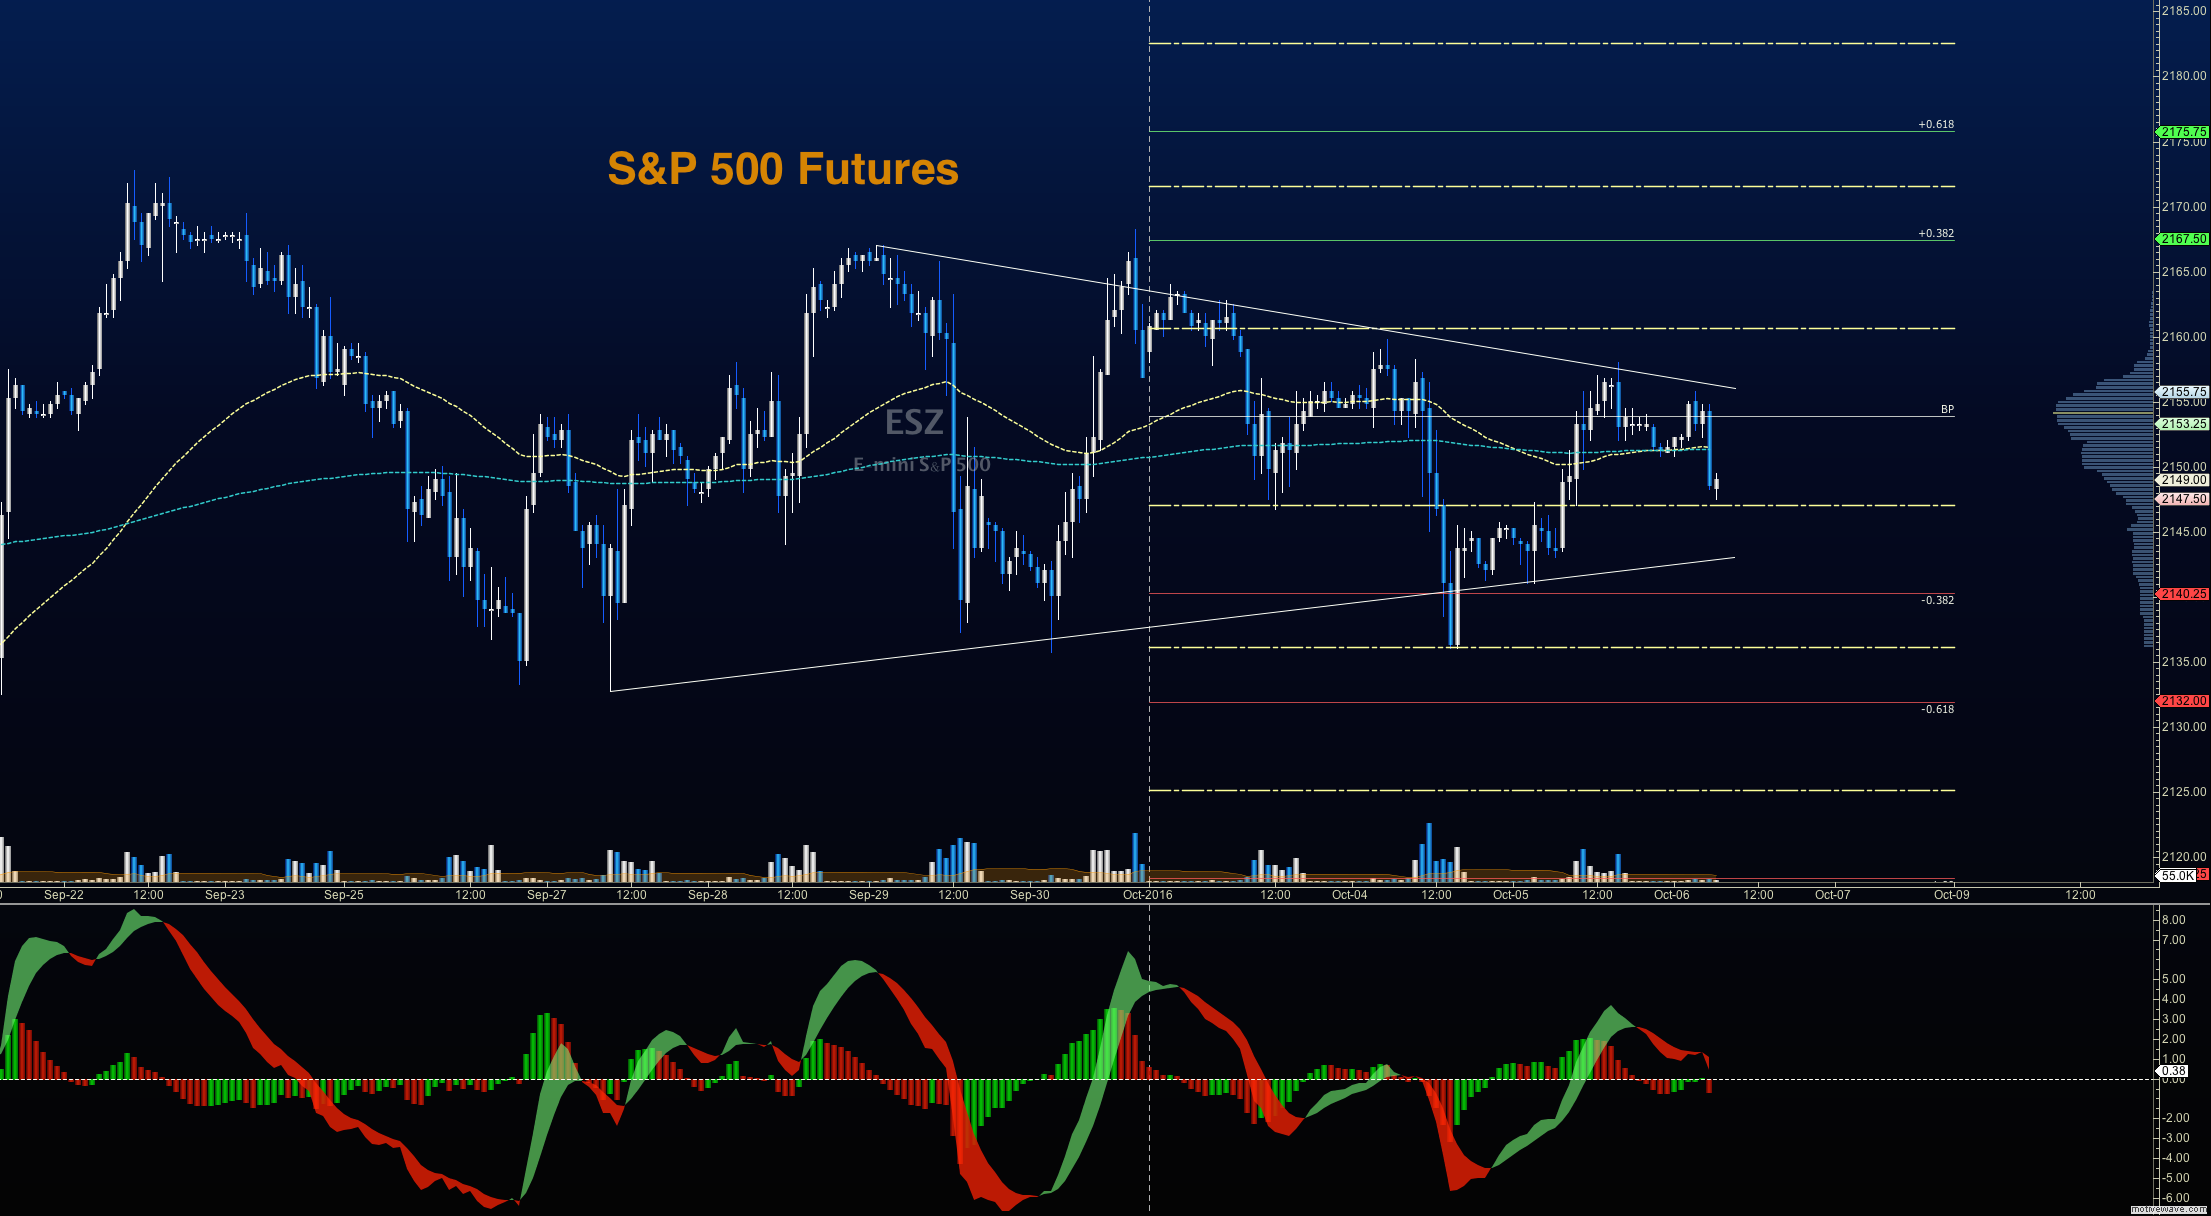
Upside trades on S&P 500 futures – Favorable setups sit on the positive retest of 2155.75, or a positive retest of the bounce off 2141.25 with upward momentum. Charts continue to be congested in these price ranges, so trading is likely to be choppy. I use the 30min to 1hr chart for the breach and retest mechanic. Targets from 2141.25 are 2145.25, 2151.25, 2155, 2157.75, 2161.25, 2163.75, and 2167.5 to 2172. As always, additional targets will be in the Members only portion of the morning blog.
Downside trades on S&P 500 futures – Favorable setups sit below the failed retest of 2146, or at the failed retest of 2151 with negative divergence. Retracements into lower levels from 2151 give us the targets 2148.25, 2145, 2141.25, 2136.25, 2134.25, 2132.5 and 2130.5 to 2122.5. As always, additional targets will be in the Members only portion of the morning blog, and in the live trading room.
Nasdaq Futures
The NQ_F continues to build a rising wedge. Support still holds at 4848, with 4835 below that. Resistance sits between 4880 and 4886 – with lots of sellers holding the price from advancing. Momentum is mixed – breakouts are still not likely to hold, while pullbacks into support may continue to be bought, even as support tests get deeper.
Upside trades on Nasdaq futures – Favorable setups sit on the positive retest of 4872.75, or a positive retest of 4856 with positive momentum. I use the 30min to 1hr chart for the breach and retest mechanic. Targets from 4857.75 are 4860.5, 4862, 4867.5, 4870.25, 4874.25, 4876.25, 4880.25, 4884, and 4887.25 to 4890. As always, additional targets will be in the Members only portion of the morning blog, and in the live trading room.
Downside trades on Nasdaq futures – Favorable setups sit below the failed retest of 4848.5, or at the failed retest of 4871 with negative divergence. Retracements into lower levels from 4871 are 4867.5, 4862.25, 4857.75, 4853.75, 4849.75, 4845.75, 4841.75, 4836.25, 4830.5, and 4824.75. See the blog for additional targets.
Crude Oil
EIA reported another draw and price is currently holding above new breakout levels, and above support near 49.1. Buyers are holding an aggressive stance, and pullbacks ought to be bought. Buyers are bound by heavy resistance near 50, with 50.14, and 50.49 above.
Trading ranges for crude oil futures should hold between 48.47 and 50.49 in the current pattern.
Upside trades on crude oil can be staged on the positive retest of 49.64, or at a positive retest off 49.27 with positive momentum. I often use the 30min to 1hr chart for the breach and retest mechanic. Targets from 49.27 are 49.51, 49.74, 49.9, 50.14, and 50.47. See the blog for more details on the chart action.
Downside trades on crude oil can be staged on the failed retest of 49.32, or at the failed retest of 49.94 with negative divergence. Targets from 49.94 are 49.74, 49.52, 49.3, 48.97, 48.64, 48.44, 48.27, and 48.04. Additional targets will be in the Members only portion of the morning blog, and in the live trading room.
If you’re interested in the live trading room, it is now primarily stock market futures content, though we do track heavily traded stocks and their likely daily trajectories as well – we begin at 9am with a morning report and likely chart movements along with trade setups for the day.
As long as the trader keeps himself aware of support and resistance levels, risk can be very adequately managed to play in either direction as bottom picking remains a behavior pattern that is developing with value buyers and speculative traders.
Twitter: @AnneMarieTrades
The author trades stock market futures every day and may have a position in mentioned securities at the time of publication. Any opinions expressed herein are solely those of the author, and do not in any way represent the views or opinions of any other person or entity.
: Creating Bullish Divergence?")


 and Semiconductors (SMH): Concerning Price Pattern?")


