Stock Market Outlook for October 31, 2016 –
The close of the month should be fairly interesting today with traders betting on both sides of a bounce or fail. My thought today is that the S&P 500 (INDEXSP:.INX) bounces into resistance – between 2136 and 2144 on S&P 500 futures. The key area of price support now being tested is between 2112.25 and 2118. Buyers continue to defend the area so shorting will be a risky bet until it shows proper breakdown form. Currently, stock market futures are bouncing from the lows and have us mildly green. Tight congestion patterns still hold between 2123 and 2137.
See today’s economic calendar with a rundown of releases.
TODAY’S RANGE OF MOTION
S&P 500 Futures Trading Chart – October 31
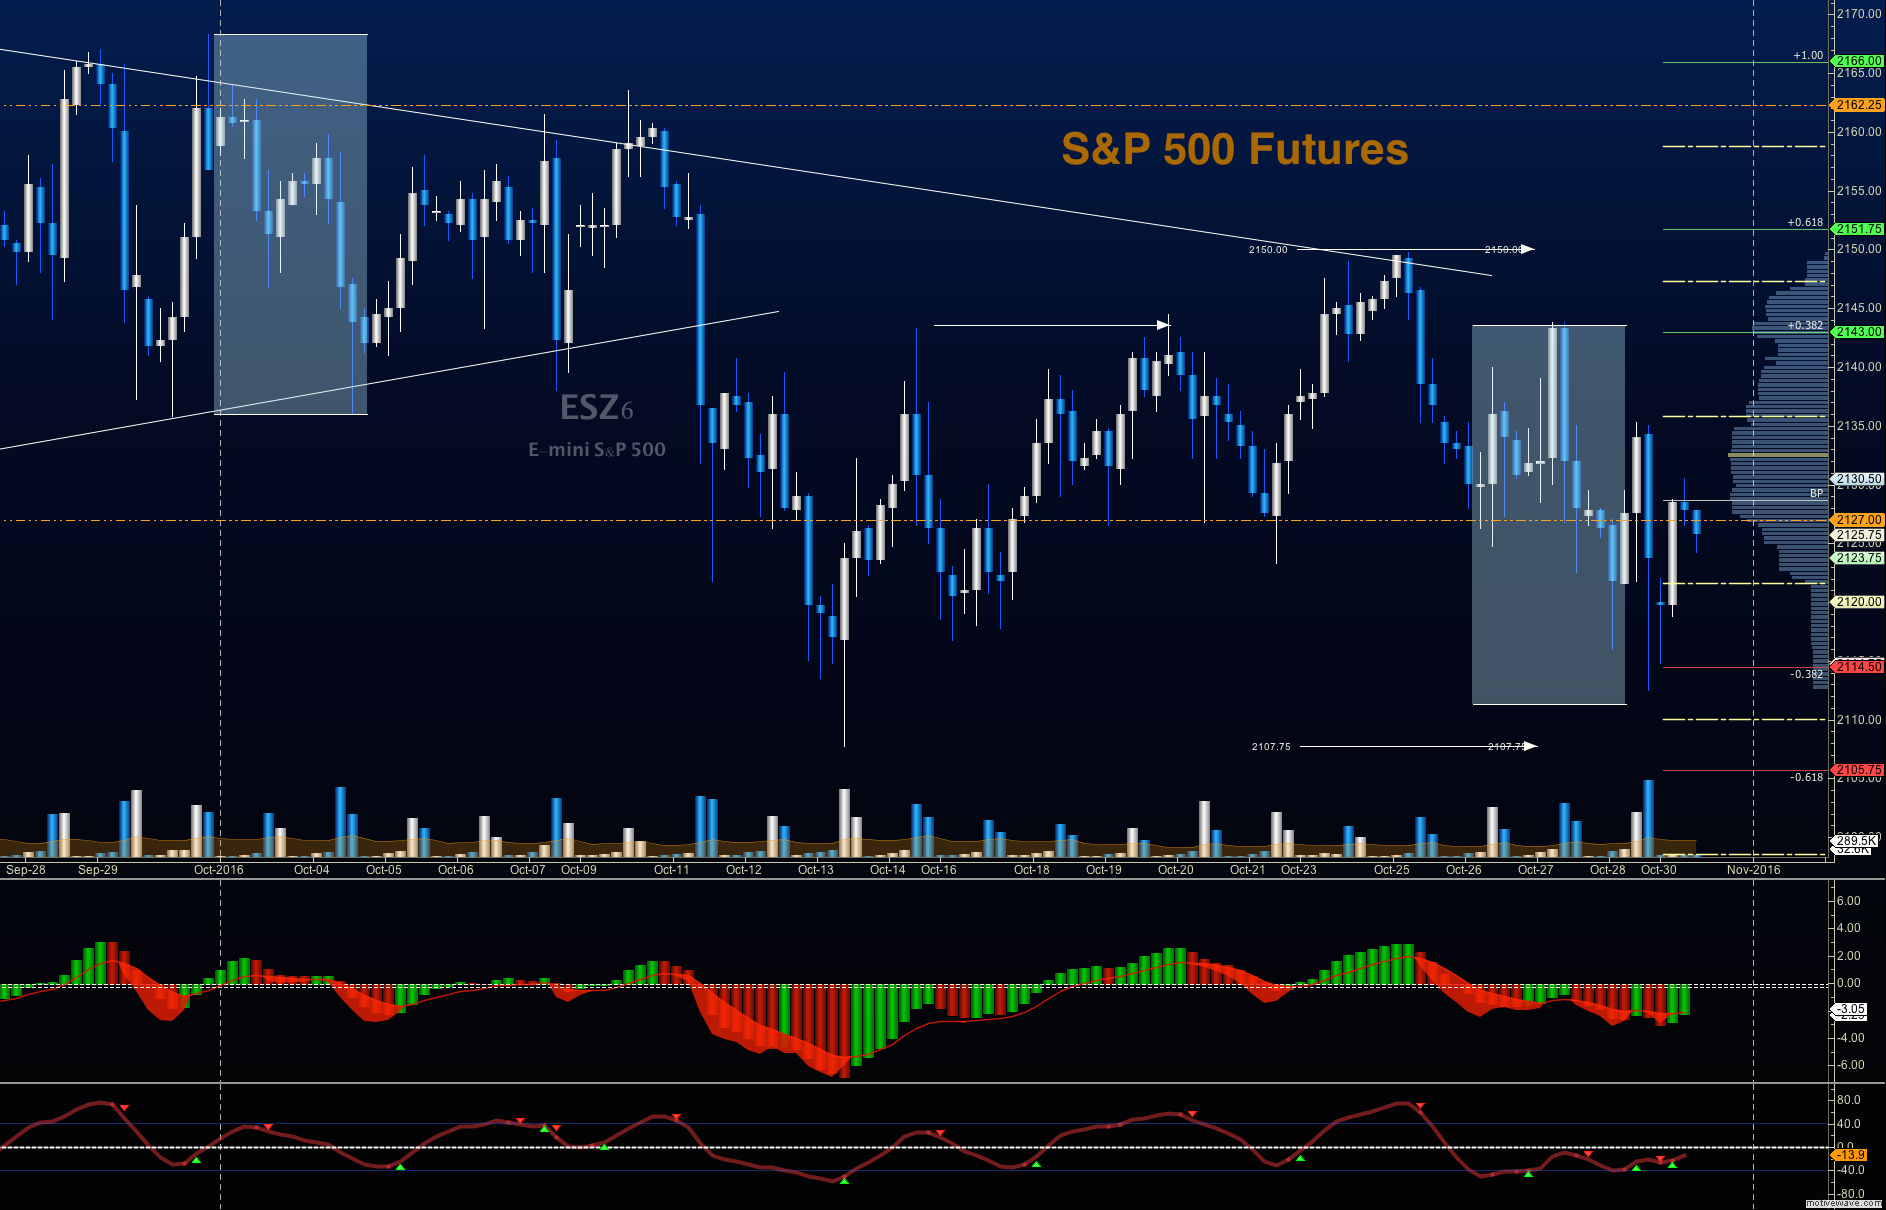
Upside trades for S&P 500 futures trading – Favorable setups sit on the positive retest of 2131.75, or a positive retest of the bounce off 2120.5 with upward momentum. I use the 30min to 1hr chart for the breach and retest mechanic. Targets from 2120.50 are 2126.5, 2130.75, 2136.5, 2140.5, 2142.5, 2144.75, and 2149.5.
Downside trades for S&P 500 futures trading – Favorable setups sit below the failed retest of 2117.5, or at the failed retest of 2130(watch for the higher low if this is attempted) with negative divergence. Retracements into lower levels from 2130 give us the targets of 2127.5, 2123.5, 2120.25, 2117.75, 2112.5, and 2107.25.
Nasdaq Futures
The NQ_F faded deeply from the highs on Tuesday and finally began a bounce from 4788 – this is the beginning of a support region that holds until 4770. The level to breach in the $NQ_F will be 4820 and as long as we stay below that level, we will be prone to buckle under selling pressure. Resistance areas are 4838 to 4854. Support sits in the region between 4754 and 4780.
Upside trades on Nasdaq futures – Favorable setups sit on the positive retest of 4820, or a positive retest of 4795 with positive momentum. I use the 30min to 1hr chart for the breach and retest mechanic. Bounces might be big, but are likely to give way to selling in the current pattern. Targets from 4795 are 4805.75, 4820.25, 4825.25, 4829.5, 4834.25, 4840.5, and 4849.5.
Downside trades – Favorable setups sit below the failed retest of 4809 (needs negative momentum here for continuation), or at the failed retest of 4840 with negative divergence. Retracements into lower levels from 4840 are 4834.75, 4829.5, 4818, 4813.75, 4806.5, 4801.75, and 4976.25.
Crude Oil
With the loss of 49 on Friday, oil cascaded into lows near 48 – new support. The failure to recapture the test of 49 above suggests further downside, with a test of deeper support near 47.48. The chart holds negative momentum for now, and deeper support near 46.4 could be ahead. The low of the trading range for Friday (see Friday’s post) held, but only by .06
Trading ranges for crude oil for the week – 46.4 to 50.88 in the current pattern.
Upside trades for crude oil can be staged on the positive retest of 49.62, or at a positive retest off 49.02 with positive momentum. I often use the 30min to 1hr chart for the breach and retest mechanic. Targets from 49.02 are 49.28, 49.6, 49.79, 50.06, 50.34, 50.74, 50.96, 51.09, 51.36, 51.65, 51.82, 52.02, and 52.24 to 52.42.
Downside trades can be staged on the failed retest of 49, or at the failed retest of 50.02 with negative divergence. Targets from 50.02 are 49.86, 49.68, 49.61, 49.33, 49.11, 49.02, 48.69, and 48.34.
Visit TheTradingBook for more information.
If you’re interested in the live trading room, it is now primarily stock market futures content, though we do track heavily traded stocks and their likely daily trajectories as well – we begin at 9am with a morning report and likely chart movements along with trade setups for the day.
As long as the trader keeps himself aware of support and resistance levels, risk can be very adequately managed to play in either direction as bottom picking remains a behavior pattern that is developing with value buyers and speculative traders.
Twitter: @AnneMarieTrades
The author trades stock market futures every day and may have a position in mentioned securities at the time of publication. Any opinions expressed herein are solely those of the author, and do not in any way represent the views or opinions of any other person or entity.

 Testing Important Price Support")
: Cup (and Maybe Handle) Watch")

