Stock Market Trading Considerations For October 2, 2017
The S&P 500 is moving higher this morning to start the new week and month. Below are key futures trading levels for the S&P 500, Nasdaq, and crude oil.
Check out today’s economic calendar with a full rundown of releases. And note that the charts below are from our premium service and shared exclusively with See It Market readers.
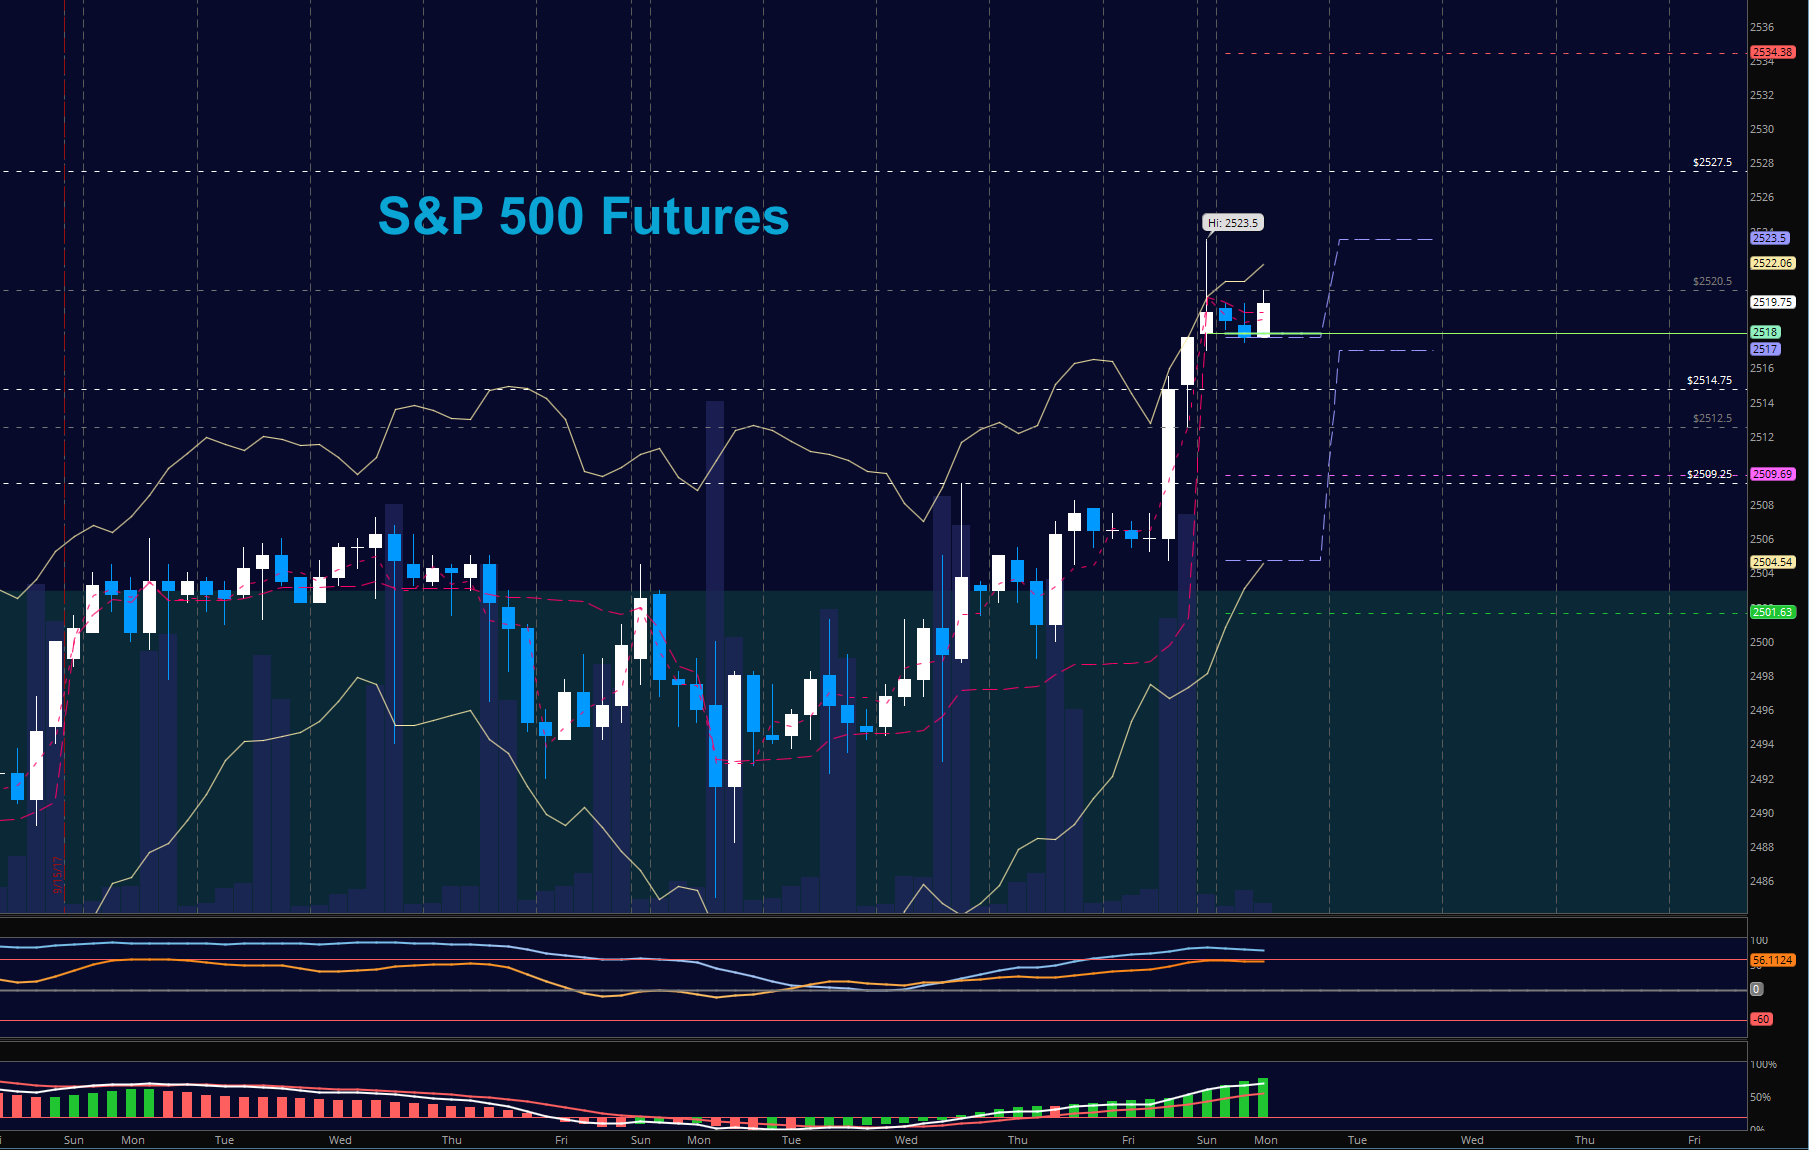
S&P 500 Futures (ES)
New highs again in the premarket as charts spike into upper sigma band extensions. New support is now at the new breakout area near 2514 with 2511 just below. Formations are bullish but slightly divergent; however, bears will be forced to buy to cover if they are short and this could give us another squeeze higher. The bullets below represent the likely shift of trading momentum at the positive or failed retests at the levels noted.
- Buying pressure intraday will likely strengthen above a positive retest of 2517
- Selling pressure intraday will likely strengthen with a failed retest of 2511
- Resistance sits near 2520.5 to 2523.5, with 2527.5 and 2534.25 above that.
- Support holds between 2515.25 and 2511.5, with 2509.25 and 2503.25 below that.
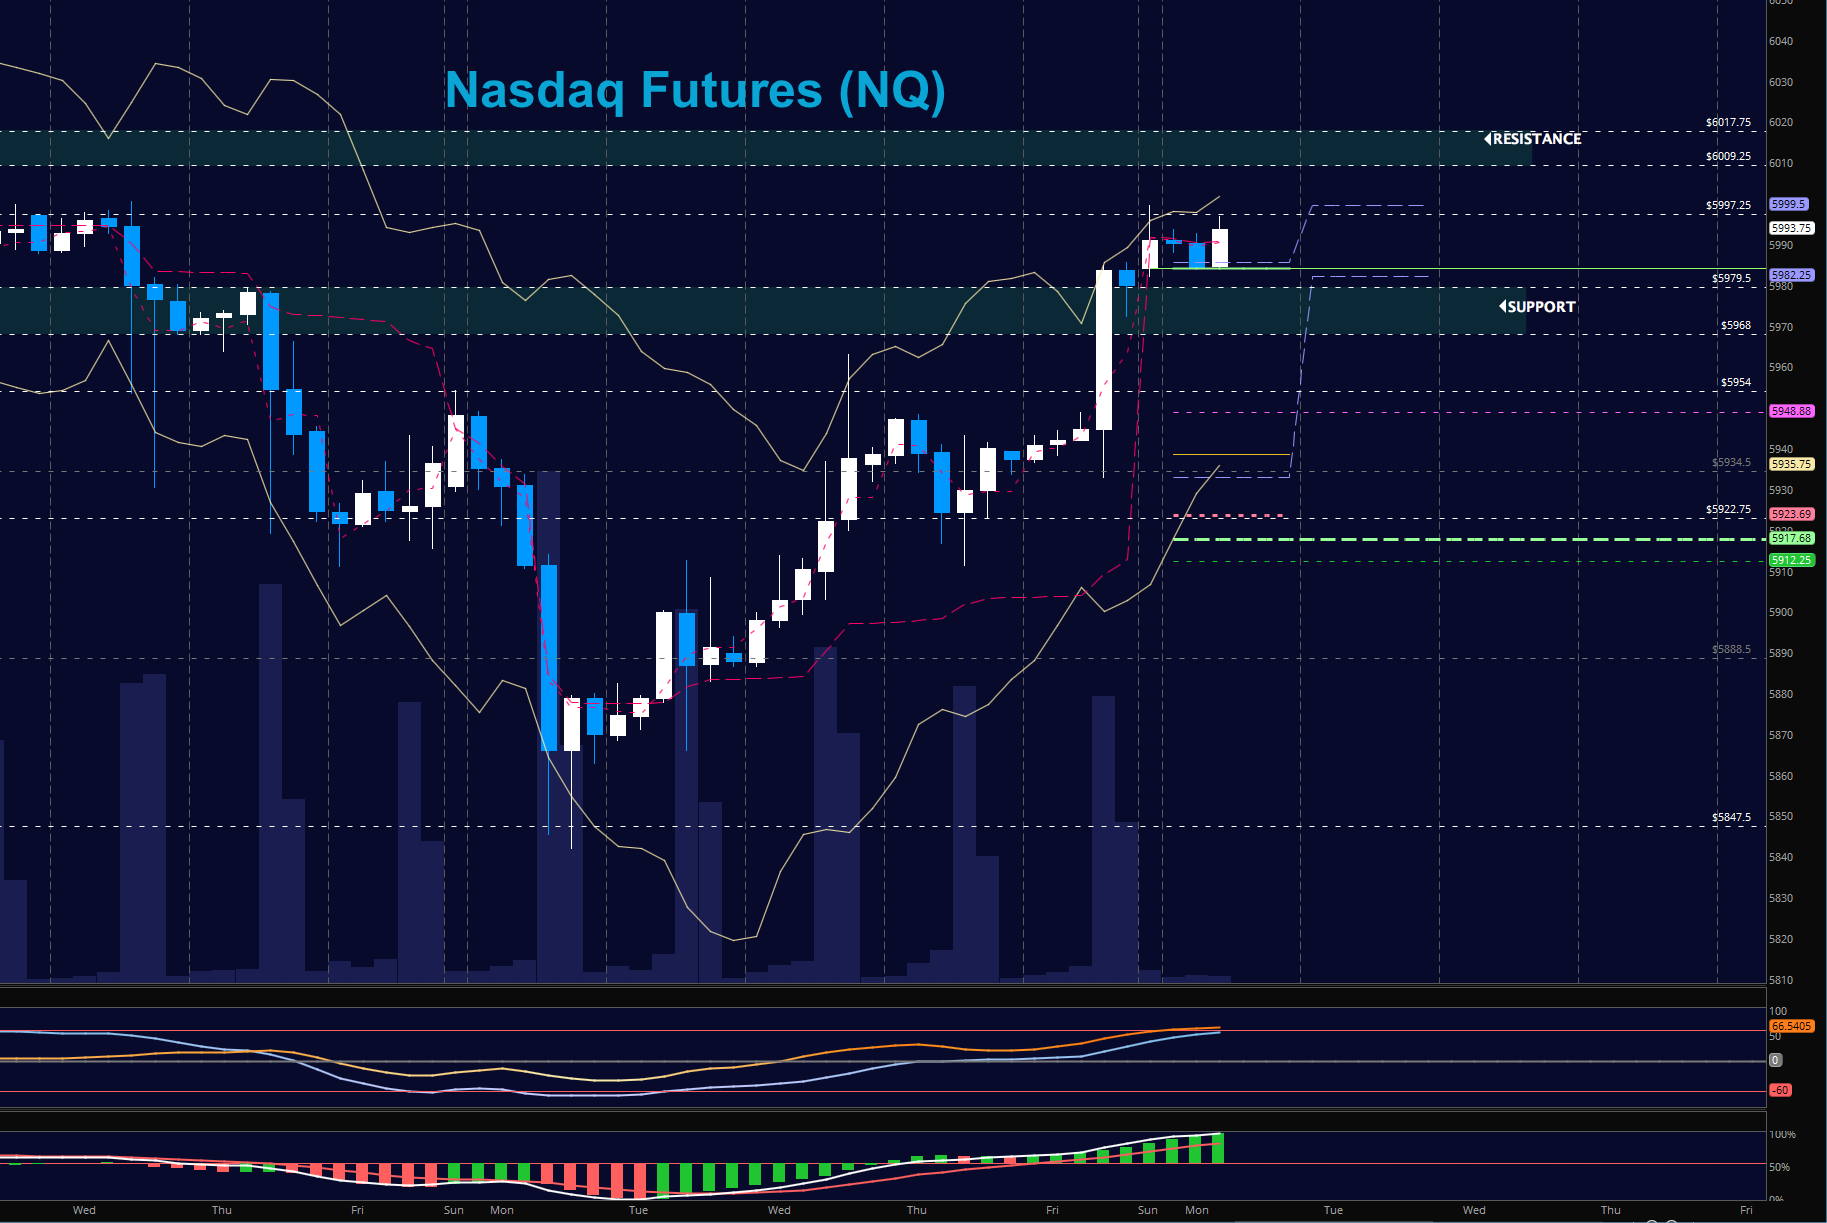
NASDAQ Futures (NQ)
Momentum shows as bullish as traders push this chart into higher resistance. Holding higher lows means we still have buyers in charge. Buyers need to hold 5985 for continuation forward. The bullets below represent the likely shift of intraday trading momentum at the positive or failed tests at the levels noted.
- Buying pressure intraday will likely strengthen with a positive retest of 5992 (but only into resistance)
- Selling pressure intraday will likely strengthen with a failed retest of 5982
- Resistance sits near 5997.75 to 6002.5, with 6009.5 and 6017.5 above that ( a pivot looms high above as well at 6055.75).
- Support holds between 5979.5 and 5968, with 5954.25 and 5935.75 below that.
WTI Crude Oil
As hedge funds reduce long exposure, WTI has tumbled right back into congestion as the battle to hold above 51 fails. Sellers still seem to have the upper hand overall but the chart is not back in heavy congestion. The bullets below represent the likely shift of trading momentum at the positive or failed tests at the levels noted.
- Buying pressure intraday will likely strengthen with a positive retest of 51.34
- Selling pressure intraday will strengthen with a failed retest of 50.5
- Resistance sits near 51.25 to 51.85, with 52.04 and 52.36 above that.
- Support holds between 50.5 to 49.98, with 49.54 and 49.09 below that.
If you’re interested in watching these trades go live, join us in the live trading room from 9am to 11:30am each trading day. Visit TheTradingBook for more information.
If you’re interested in the live trading room, it is now primarily stock market futures content, though we do track heavily traded stocks and their likely daily trajectories as well – we begin at 9am with a morning report and likely chart movements along with trade setups for the day.
As long as the trader keeps himself aware of support and resistance levels, risk can be very adequately managed to play in either direction as bottom picking remains a behavior pattern that is developing with value buyers and speculative traders.
Twitter: @AnneMarieTrades
The author trades stock market futures every day and may have a position in mentioned securities at the time of publication. Any opinions expressed herein are solely those of the author, and do not in any way represent the views or opinions of any other person or entity.


