Stock Market Futures Outlook for November 29, 2016 –
Tuesday begins with a muted move to the north. S&P 500 futures are currently holding just above price support near 2199 – 2197. I suspect we test that support level again yet we should remain bound by 2209 (overhead price resistance). Traders continue to struggle with lower volume and mixed views on market direction today. The line in the sand for buying support intraday will be 2198 on S&P 500 futures. That level should be a battleground with the winner driving price into levels of deeper price support, 2194-2191, or price resistance, 2208.5-2212. Momentum is bullish in form for the S&P 500 (INDEXSP:.INX), but under pressure. Movement is likely to be muted through the day.
See today’s economic calendar with a rundown of releases.
TODAY’S RANGE OF MOTION
S&P 500 Futures Trading Chart – November 29
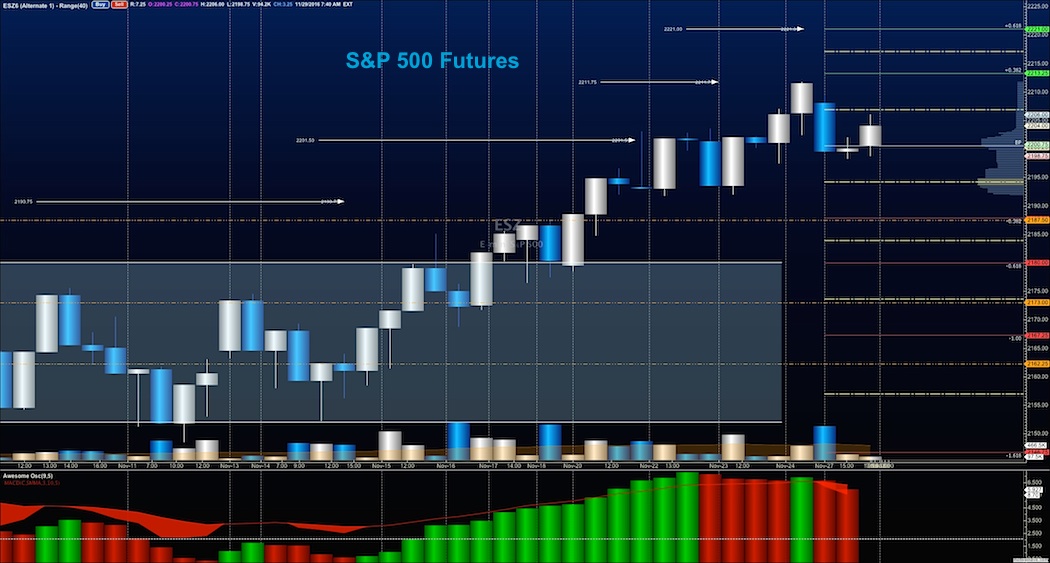
Upside trades for S&P 500 futures – Two options for entry
Positive retest of continuation level: 2208.50
Positive retest of support level: 2199
Opening targets ranges: 2203.5, 2205.75, 2208.5, 2211.75, and 2215.50
Downside trades for S&P 500 futures – Two options for entry
Failed retest of resistance level: 2208.25
Failed retest of support level: 2198
Opening target ranges: 2204.75, 2201.75, 2198.50, 2197, 2194.50, 2191.25, and 2187.50
Nasdaq Futures
The NQ_F has been grinding sideways to slightly higher over the last three days. Support levels to watch today will be near 4842-4852. Resistance remains within the region from 4870.5 to 4880. Momentum is damp and both buyers and sellers are not anxious to participate. Volume continues to be light.
Upside trades for Nasdaq futures – Two options
Positive retest of continuation level: 4870.5
Positive retest of support level: 4857.5
Opening target ranges: 4860.50, 4865.25, 4868.5, 4874.75, 4878.75, 4880, 4884.50, 4890.50, and 4894 to 4899 if we expand (very unlikely)
Downside trades for Nasdaq futures – Two options
Failed retest of resistance level: 4872.75
Failed retest of support level: 4853.75
Opening target ranges: 4868.75, 4864.50, 4860.25, 4857.50, 4854.25, 4850.75, 4846, 4842.75, and 4837.50
Crude Oil
Chatter continues to shift oil back and forth. Right now, we are drifting to support near 45.65. This should hold as support unless news drags on the weight of price sending us close to 45.14 and then 44.4 support zones. Resistance rests between 46.8 and 47.36. The API report is released today after market close, ET, and the EIA report is tomorrow.
Upside trades for Crude Oil – Two options
Positive retest of continuation level: 46.84
Positive retest of support level: 45.84
Opening target ranges: 46.1, 46.34, 46.78, 47.10, 47.4, 47.70, 48.3, 48.54, 48.74, 48.94, and 49.14
Downside trades for Crude Oil – Two options
Failed retest of resistance level: 46.7
Failed retest of support level: 45.6
Opening target ranges: 46.46, 46.14, 45.86, 45.56, 45.3, 45.17, and 44.79 if we fail to recover the low test of the morning.
If you’re interested in the live trading room, it is now primarily stock market futures content, though we do track heavily traded stocks and their likely daily trajectories as well – we begin at 9am with a morning report and likely chart movements along with trade setups for the day.
As long as the trader keeps himself aware of support and resistance levels, risk can be very adequately managed to play in either direction as bottom picking remains a behavior pattern that is developing with value buyers and speculative traders.
Twitter: @AnneMarieTrades
The author trades stock market futures every day and may have a position in mentioned securities at the time of publication. Any opinions expressed herein are solely those of the author, and do not in any way represent the views or opinions of any other person or entity.


: Creating Bullish Divergence?")


