Stock Market Futures Trading Considerations For May 2, 2017
The major indices are drifting sideways to higher into the FOMC Fed meeting. The S&P 500 (INDEXSP:.INX) has been consolidating recent gains but is showing mixed momentum. The Nasdaq (INDEXNASDAQ:.IXIC) continues to lead but several major earnings reports are due today.
Check out today’s economic calendar with a full rundown of releases. And note that the charts below are from our premium service at The Trading Book and are shared exclusively with See It Market readers.
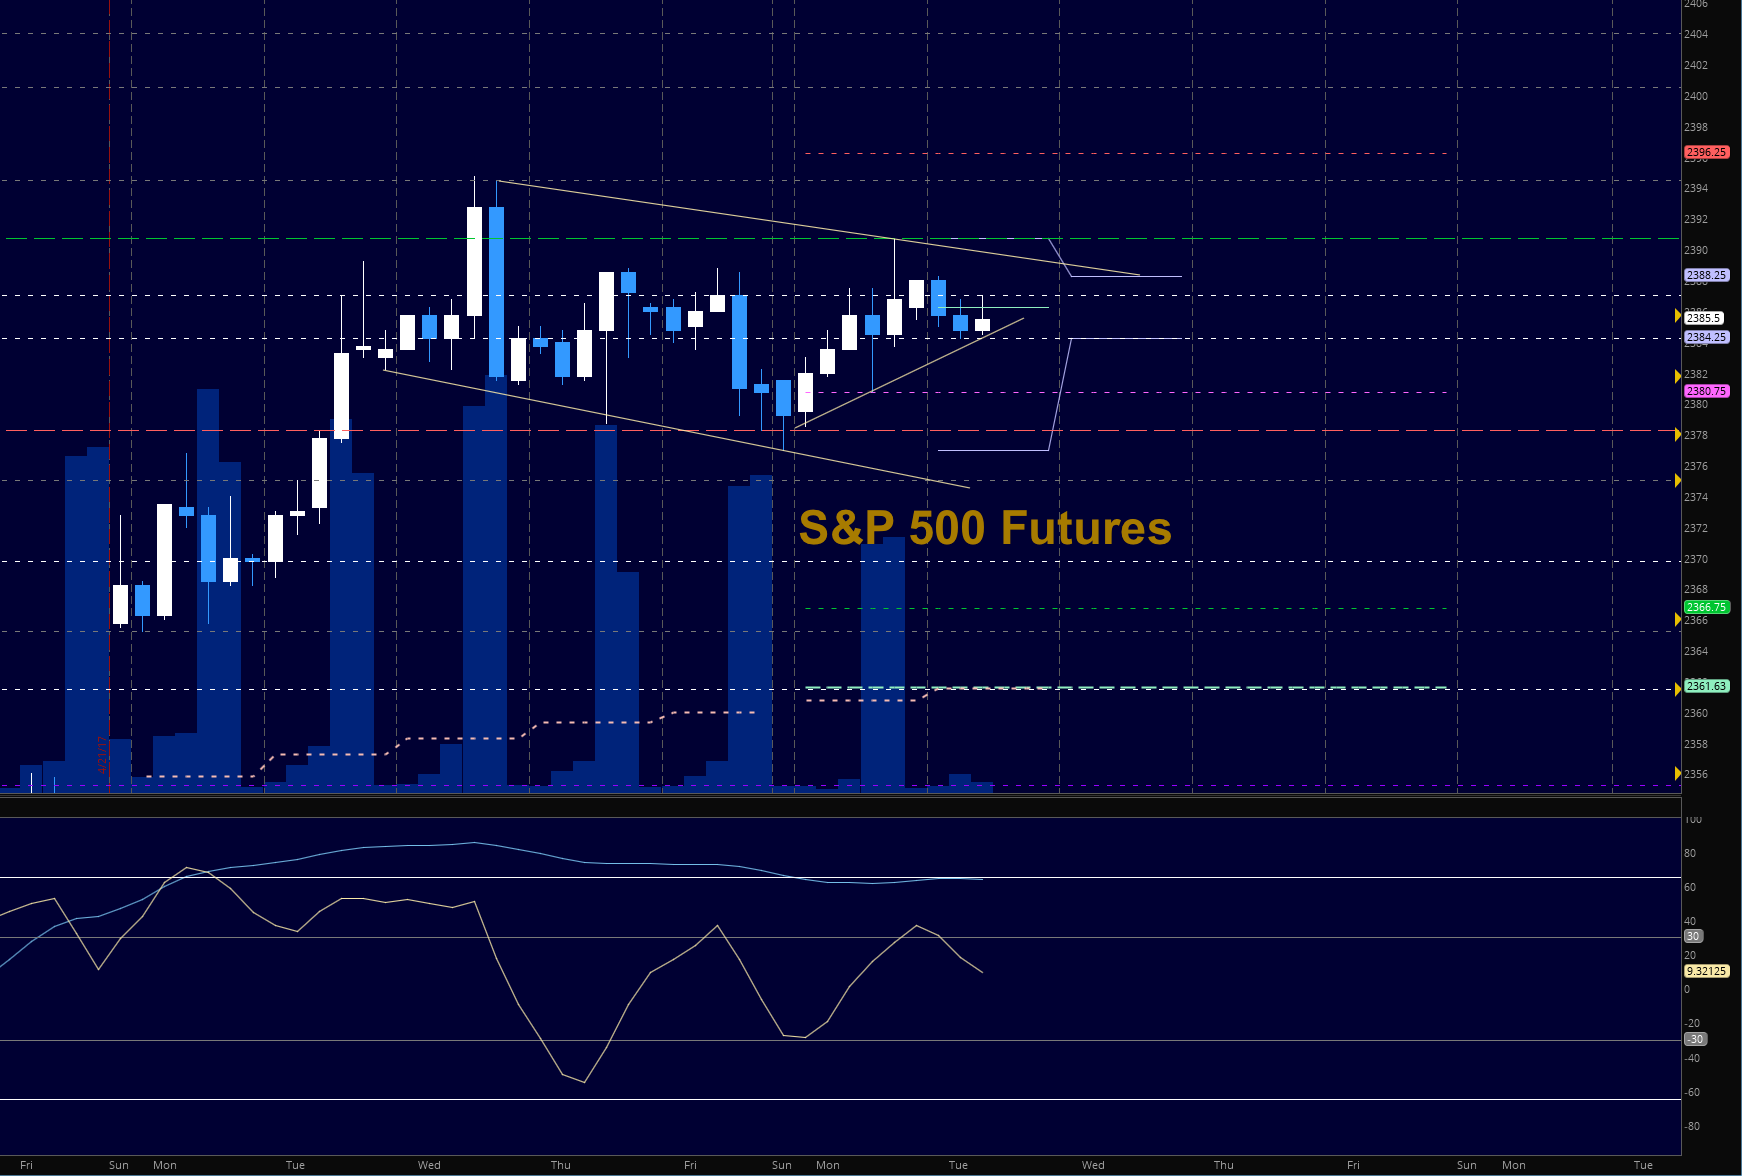
S&P 500 Futures (ES)
We begin a second morning just below the key level of 2386. Sellers are camped between 2387 and 2391 with support levels higher, squeezing price action into a narrow range. Momentum remains mixed today with deeper support still finding buyers. The level 2380.5 holds as support with 2378 just below. Price action is congested. The bullets below represent the likely shift of trading momentum at the positive or failed tests at the levels noted:
- Buying pressure intraday will likely strengthen above a positive retest of 2389.5 ( careful here)
- Selling pressure intraday will likely strengthen with a failed retest of 2380.5
- Resistance sits near 2389.5 to 2392.25, with 2394.5 and 2397 above that
- Support holds between 2380.5 and 2378, with 2375.25 and 2369.5 below that
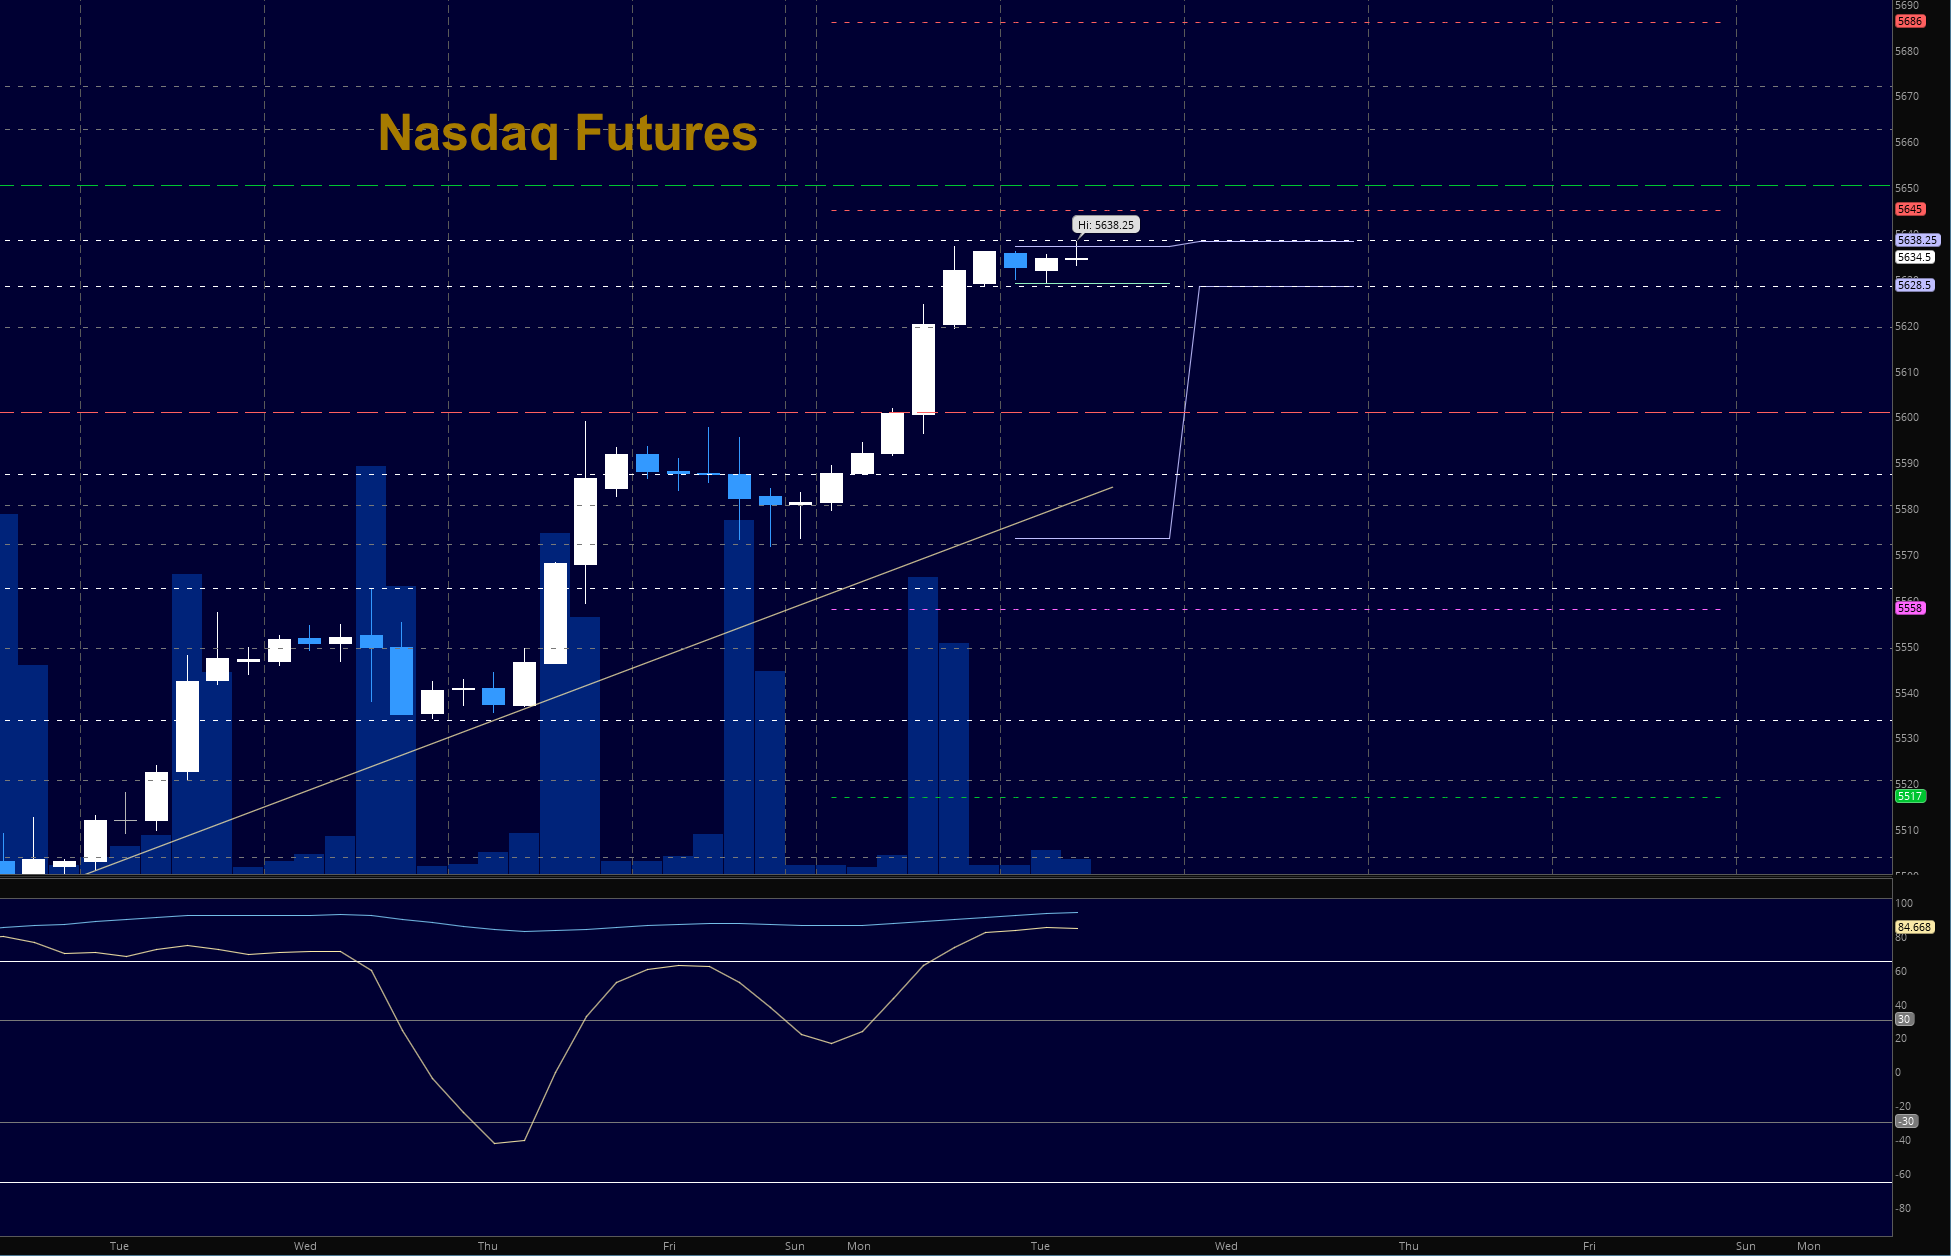
NASDAQ Futures (NQ)
Several big hitters release earnings reports over the coming days in this chart as we continue to test new highs. There is a Fibonacci retracement into a completed ABCD at 5638.5 and we tested there a short time ago this morning. Under the current momentum, pullbacks will continue to find buying support at the first pass. Buyers hold support at 5628.5 this morning with 5619.5 below that. Sellers have rejected the Fibonacci target but momentum is not in their favor at all. The bullets below represent the likely shift of trading momentum at the positive or failed tests at the levels noted:
- Buying pressure intraday will likely strengthen with a positive retest of 5639 (careful here as it is a pattern completion)
- Selling pressure intraday will likely strengthen with a failed retest of 5619.25
- Resistance sits near 5638.5 to 5644.25, with 5650.5 and 5662.25 above that
- Support holds between 5619.25 and 5602.25, with 5594.75 and 5582.5 below that
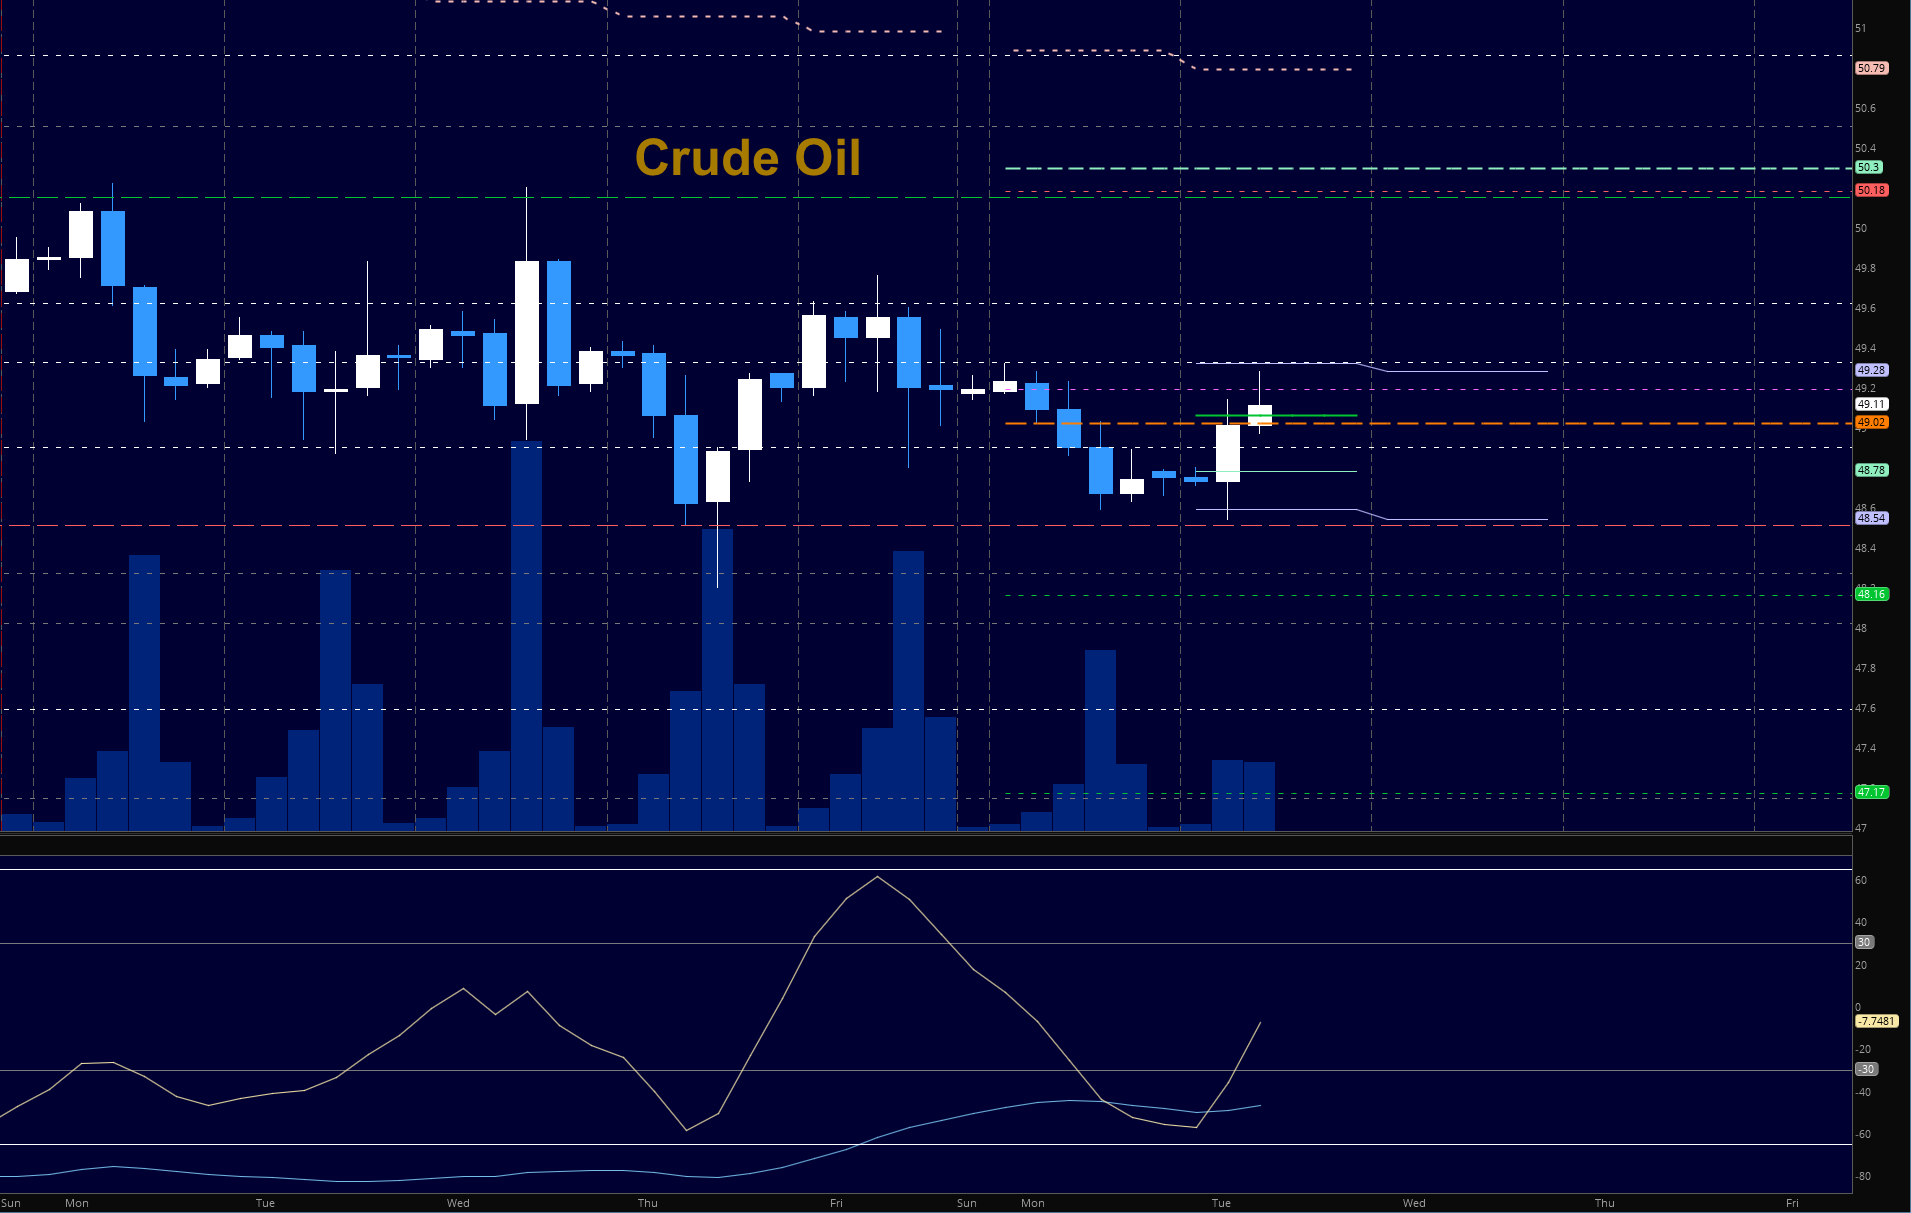
Crude Oil –WTI
I just just write “redux” here and be done with it =), but we are still resolving around this region. Keep it in your mind as it will be important over time. Monthly support levels near 49.1 have brought buyers and sellers together in a battle that has yet to be resolved. Some buying pressure is showing however, which is different to days past. Early morning sellers have drawn the line near 49.3 for the second day and momentum suggests that big bounces will fade but likely hold higher lows. The bullets below represent the likely shift of trading momentum at the positive or failed tests at the levels noted:
- Buying pressure intraday will likely strengthen with a positive retest of 49.32
- Selling pressure intraday will strengthen with a failed retest of 48.7 (note that even if it loses this level they will try to press price back to test the level- as they did yesterday)
- Resistance sits near 49.62 to 50.2, with 50.78 and 51.34 above that.
- Support holds between 48.7 and 48.53, with 48.27 and 48.02 below that.
If you’re interested in watching these trades go live, join us in the live trading room from 9am to 11:30am each trading day. Visit TheTradingBook for more information.
Our live trading room is now primarily stock market futures content, though we do track heavily traded stocks and their likely daily trajectories as well – we begin at 9am with a morning report and likely chart movements along with trade setups for the day.
As long as the trader keeps himself aware of support and resistance levels, risk can be very adequately managed to play in either direction as bottom picking remains a behavior pattern that is developing with value buyers and speculative traders.
Twitter: @AnneMarieTrades
The author trades stock market futures every day and may have a position in mentioned securities at the time of publication. Any opinions expressed herein are solely those of the author, and do not in any way represent the views or opinions of any other person or entity.


")


