Stock Market Futures Trading Considerations For March 30, 2017
Higher lows continue to form on the S&P 500 (INDEXSP:.INX) in a grind towards resistance (for now). Momentum is drifting so traders will have to remain disciplined and focused into quarter end.
Check out today’s economic calendar with a full rundown of releases. And note that the charts below are from our premium service at The Trading Book and are shared exclusively with See It Market readers.
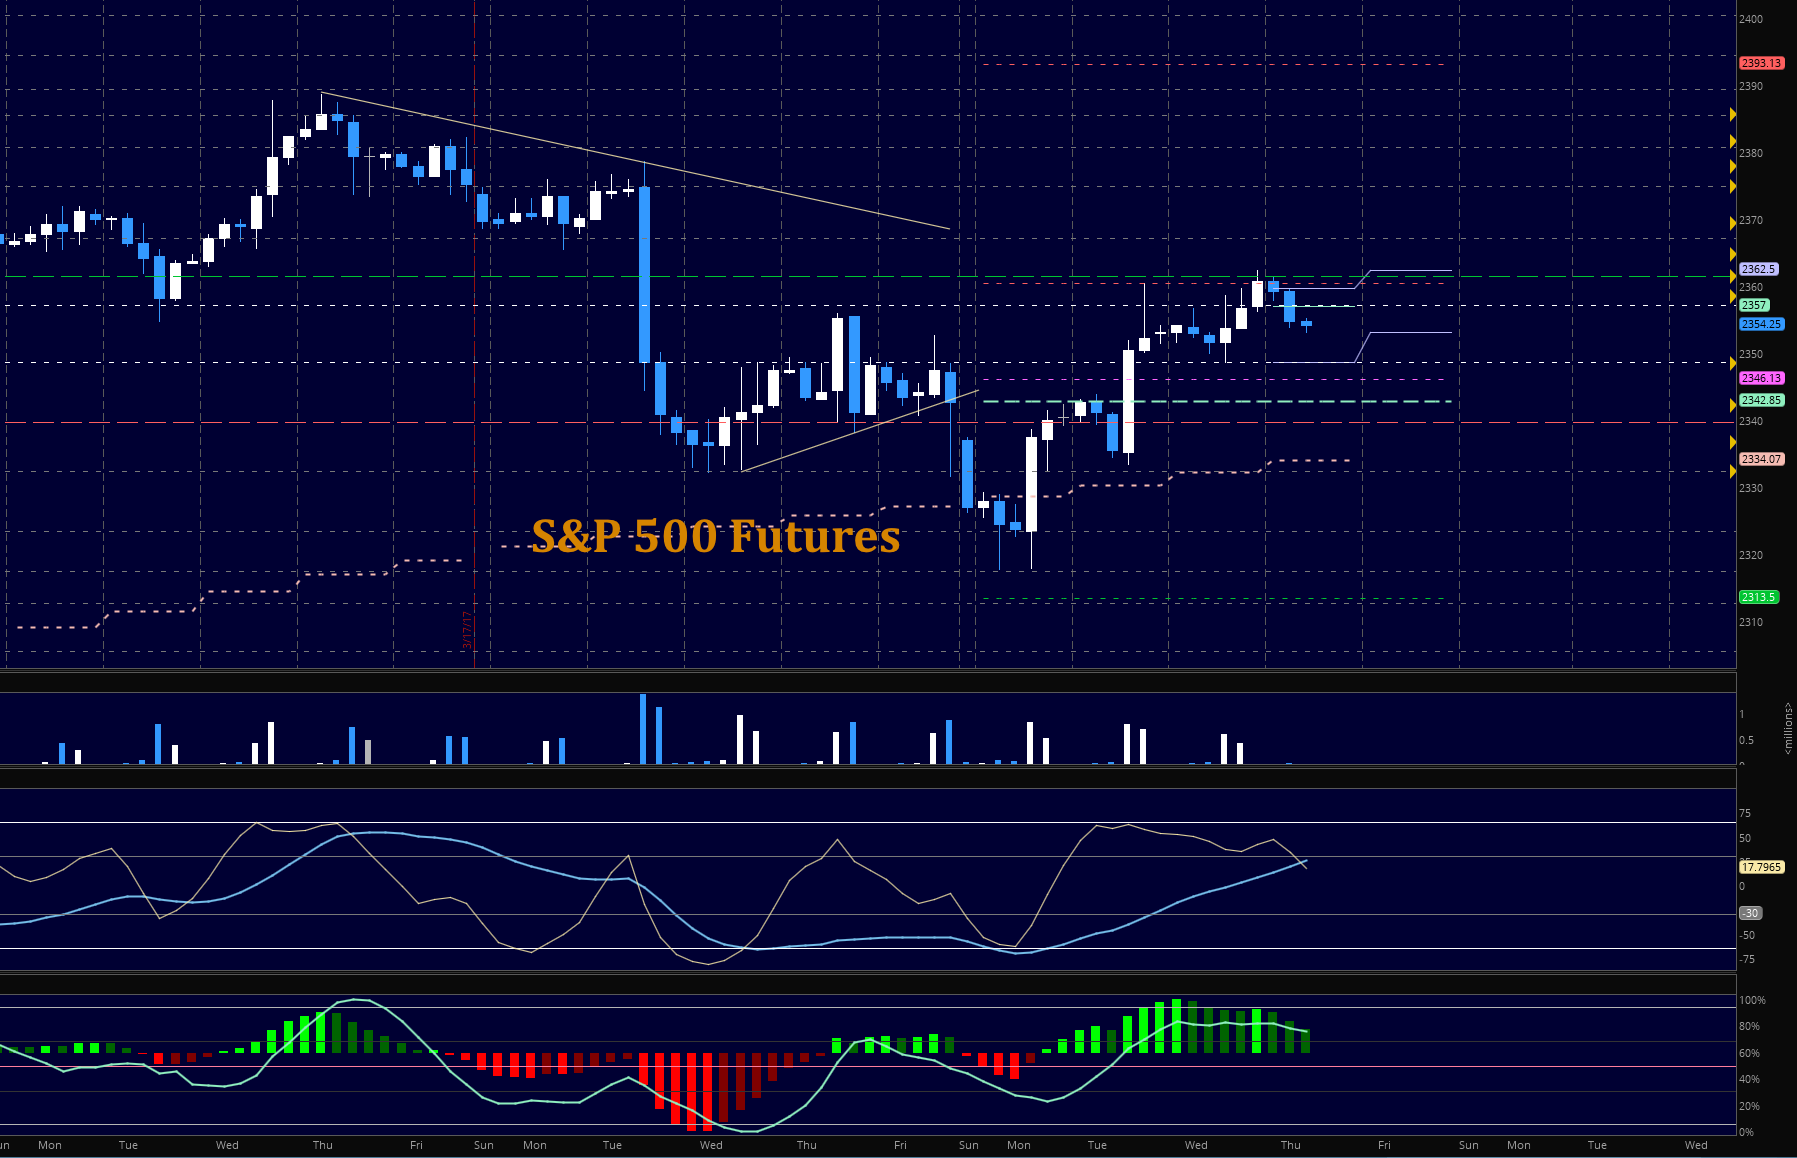
S&P 500 Futures (E-mini)
Prices have been grinding sideways toward resistance at 2361.5, then at 2367 to 2371. It is unclear due to momentum drift whether the charts will test these ranges today but if they do, they are likely to fail to hold the higher resistance. As we close the quarter, we’ll see performers strengthen and laggards lose further as portfolio managers jockey holdings. Key support holds around 2350. Resistance levels that will test seller strength are now near 2362 and 2366.
- Buying pressure will likely strengthen above a positive retest of 2357.5
- Selling pressure will likely strengthen with a failed retest of 2348
- Resistance sits near 2358.75 to 2362.5, with 2368.5 and 2372.25 above that
- Support holds between 2348.5 and 2342.5, with 2338.5 and 2330.5 below that
Upside trades – Two options for entry
- Positive retest of continuation level – 2356.75
- Positive retest of support level – 2351.5
- Opening targets ranges – 2354.5, 2361.5, 2365.25, 2367.5, 2372.75, 2375, 2377.5, 2381.5, 2385.75, 2389.75, 2392.5, 2396, 2400.5, 2404, 2411.75, 2423.25
Downside trades – Two options for entry
- Failed retest of resistance level – 2349.75
- Failed retest of support level – 2342.5
- Opening target ranges – 234.5, 2341.75, 2336.25, 2332.75, 2328.75, 2325.75, 2320.5, 2317.75, 2313.75, 2307.75, 2304.75, 2299, 2293
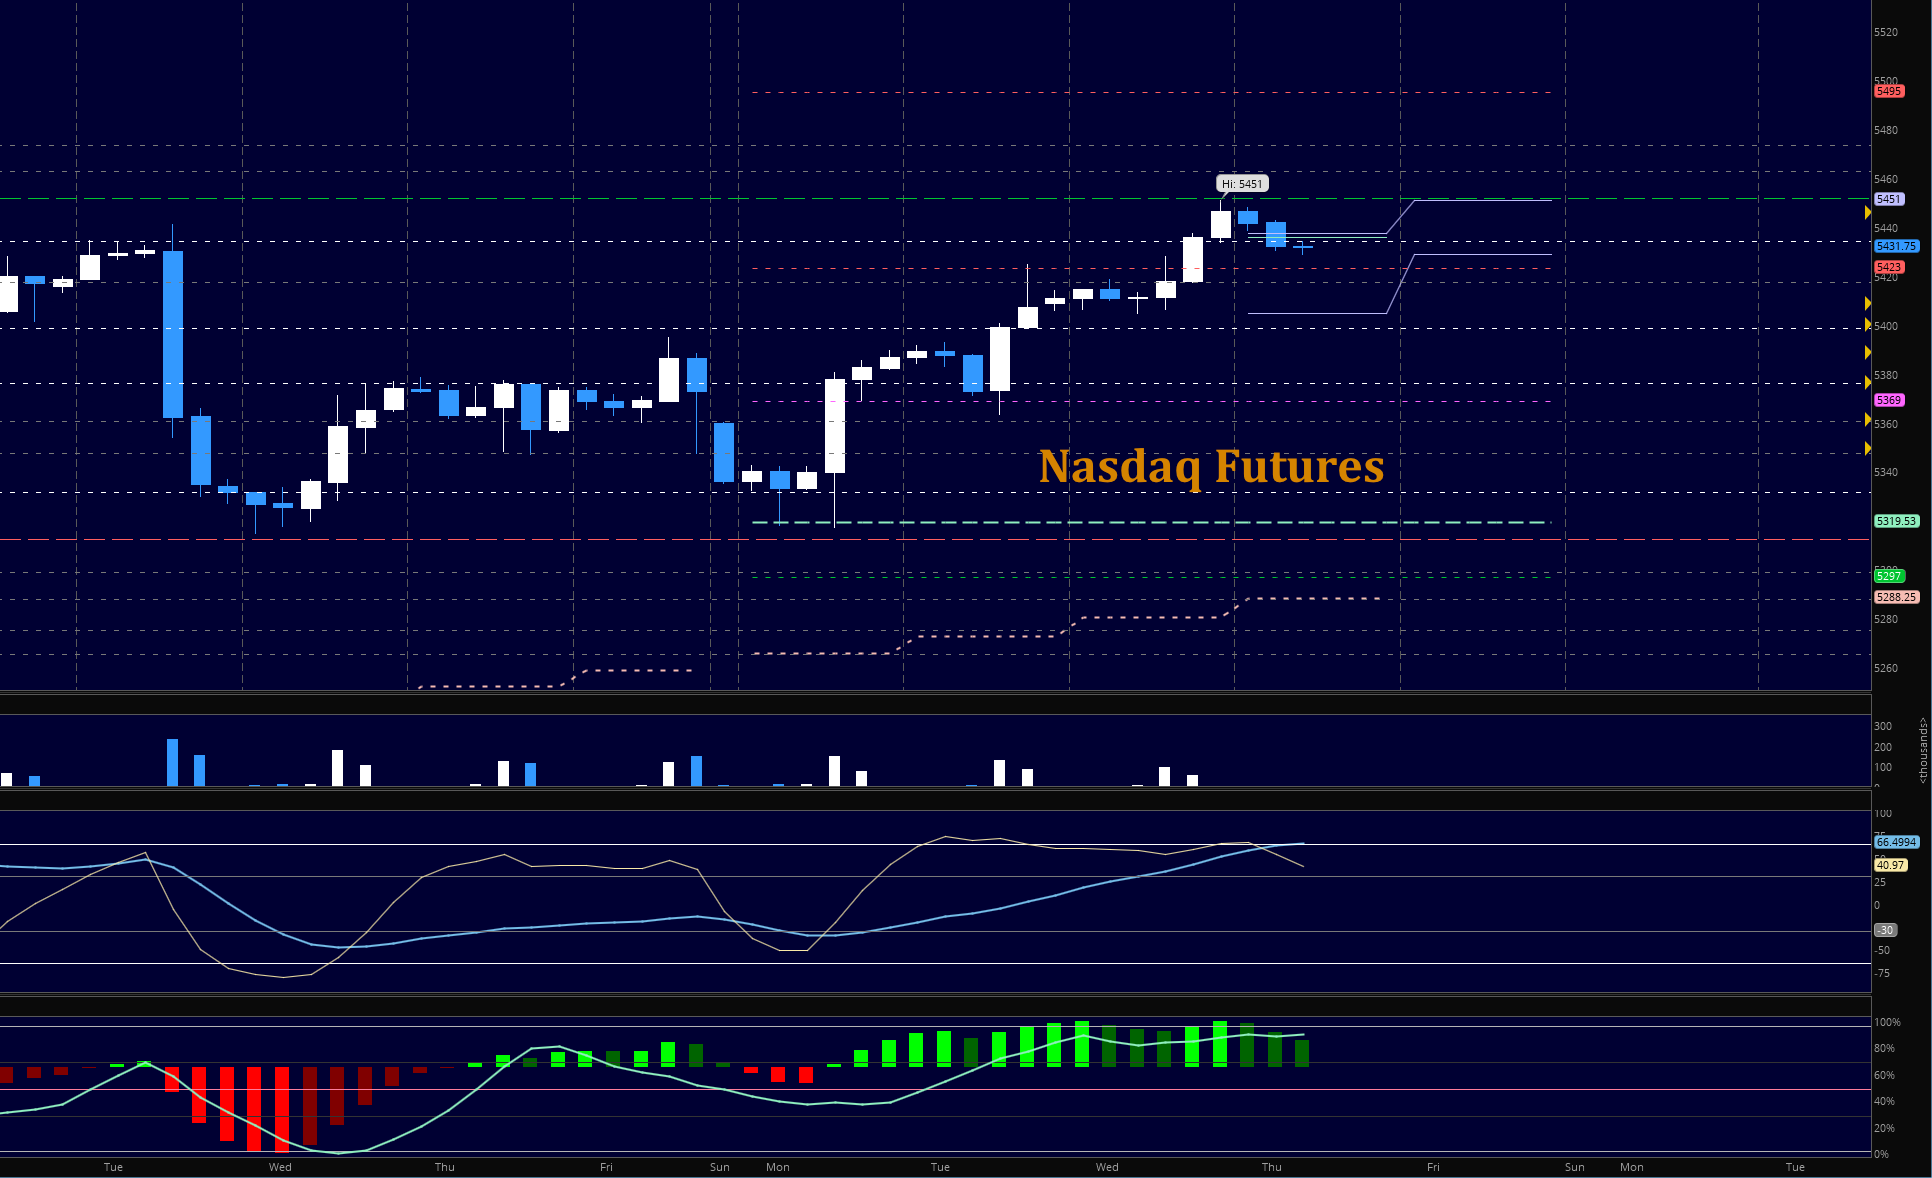
NASDAQ Futures
Momentum holds steady for another day as the performing sectors of the quarter get an added boost from end of the quarter portfolio rebalancing. Buyers are holding a breakout area and now look to retest prior highs and a potential retest of overnight levels looks possible. In the current formation, buyers are very likely to hold support areas with new pressure holding us above 5420 in the current formation. The failed retest of that level will be sure to embolden sellers in the short term.
- Buying pressure will likely strengthen with a positive retest of 5446.5 (use caution-wait for a retest)
- Selling pressure will likely strengthen with a failed retest of 5414
- Resistance sits near 5446.5 to 5452, with 5462.5 and 5473.5 above that
- Support holds between 5420.25 and 5404.25, with 5388.5 and 5347.5 below that
Upside trades – Two options
- Positive retest of continuation level – 5442 (make sure you have that retest)
- Positive retest of support level – 5428.75
- Opening target ranges – 5404.75, 5410.5, 5417.75, 5422.25, 5426.5, 5434.25, 5440, 5443.75, 5452, 5462.25,
Downside trades- Two options
- Failed retest of resistance level – 5430.25 (watch for higher lows if chart tries to reverse and move upward)
- Failed retest of support level – 5420.5
- Opening target ranges – 5423.75, 5410.75, 5404, 5398.5, 5388.25, 5376.25, 5369.5, 5361.5, 5356.25, 5347.75, 5341.5, 5331.5, 5324.5, 5318.75, 5312.75, 5306.5
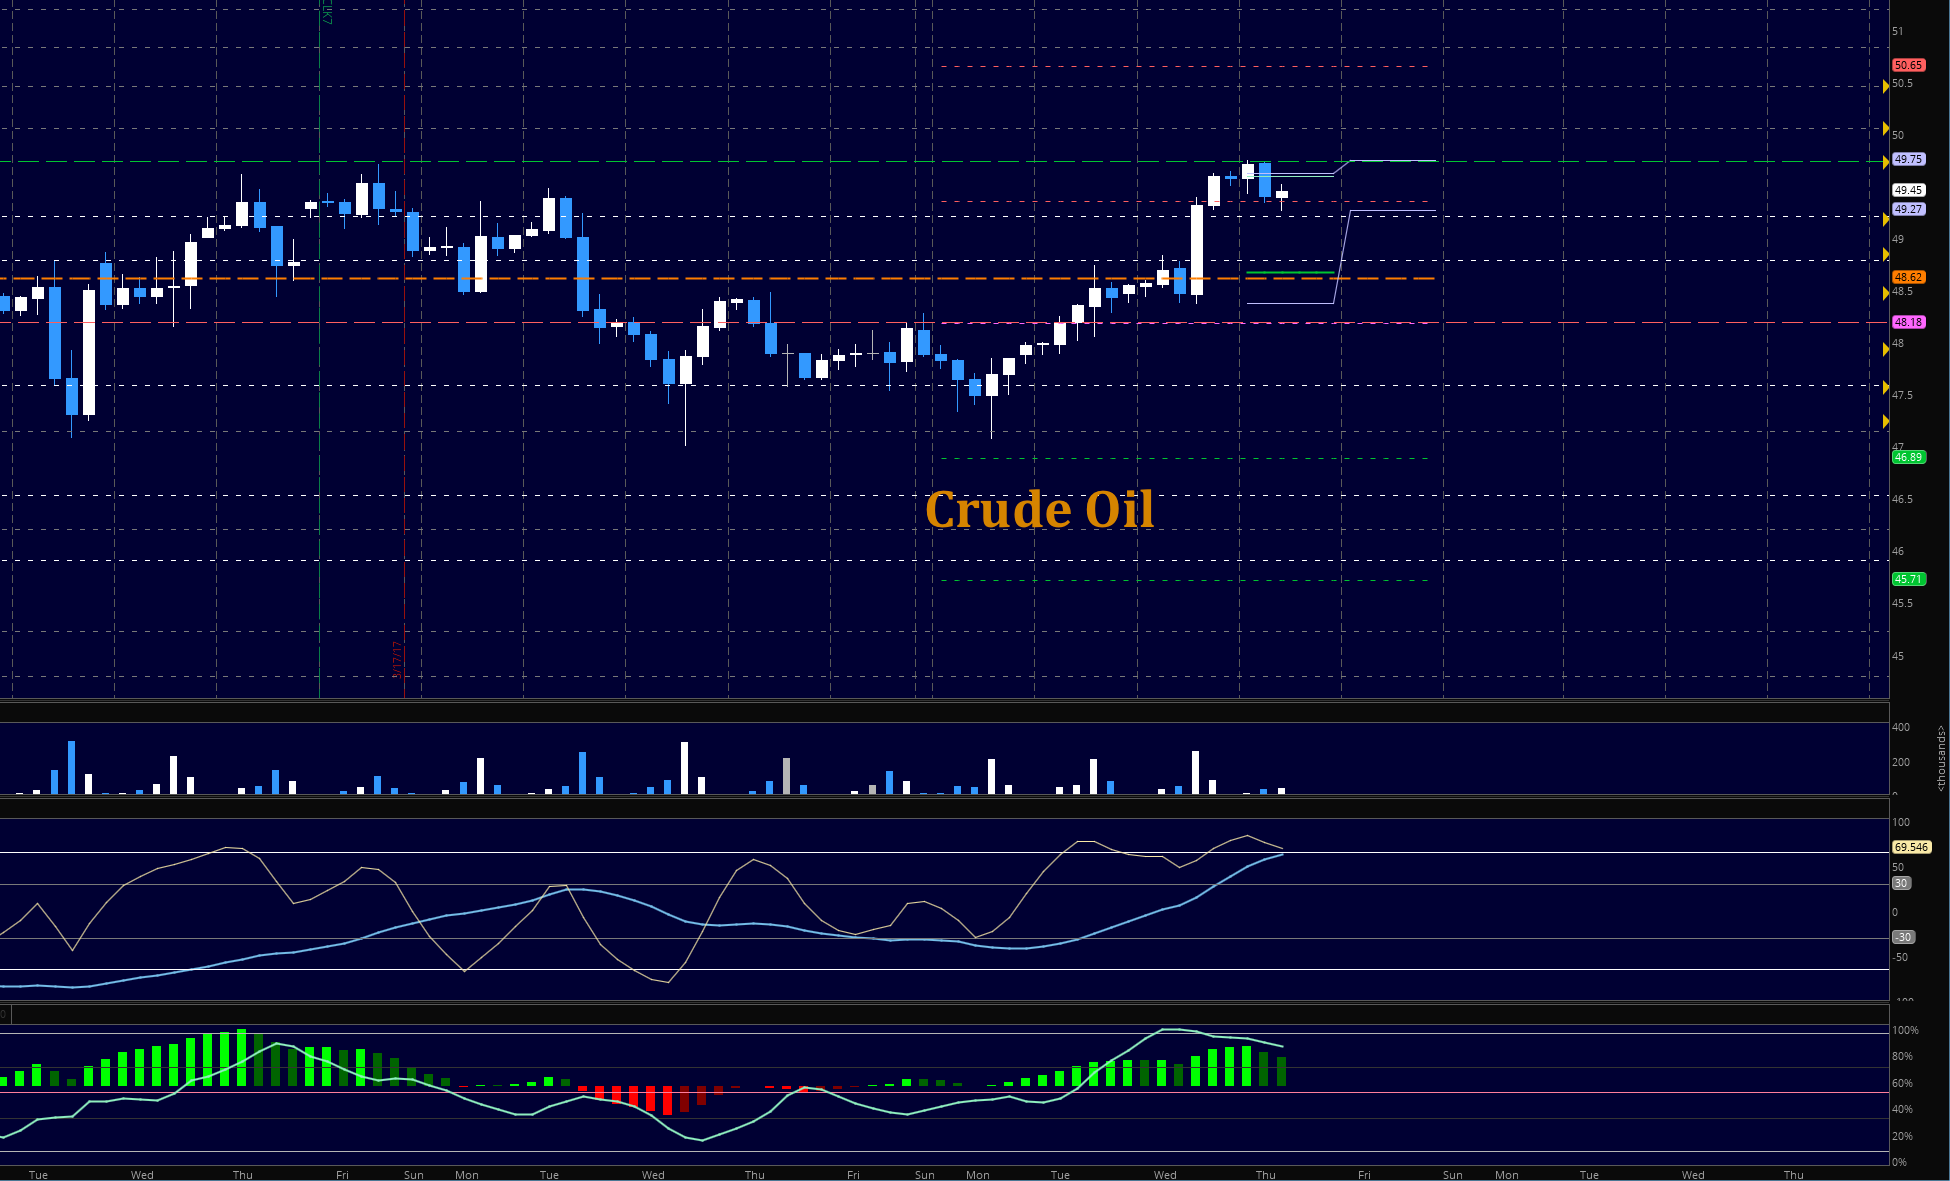
Crude Oil –WTI
Oil bounced nicely off support zones to test the levels noted in the image near 49.72 and is testing new support as an anchor before attempting the test at 50.05 next. If the weight of motion shifts too quickly, we’ll see a run as sellers will rush to exit. In general, however, I suspect a test of the midlines of congestion below current levels before the chart expands to test levels above. I’ll be quite alert here as the balance could shift without much notice in either direction.
- Buying pressure will likely strengthen with a positive retest of 49.74
- Selling pressure will strengthen with a failed retest of 48.18
- Resistance sits near 49.74 to 50.09, with 50.47 and 50.84 above that.
- Support holds between 48.79 and 47.59, with 47.19 and 46.6 below that.
Upside trades – Two options
- Positive retest of continuation level -49.60 ( could easily be resistance- use caution)
- Positive retest of support level– 48.79
- Opening target ranges – 48.5, 48.71, 48.84, 49.12, 49.37, 49.74, 50.06, 50.38, 50.84, 51.11, 51.7, 52.14, 52.6
Downside trades- Two options
- Failed retestof resistance level – 49.17 (watch for possible support building)
- Failed retestof support level – 48.60
- Opening target ranges – 48.86, 48.62, 48.19, 47.92, 47.64, 47.47, 47.26, 47.04, 46.90, 46.53, 46.21, 45.94
If you’re interested in watching these trades go live, join us in the live trading room from 9am to 11:30am each trading day. Visit TheTradingBook for more information.
Our live trading room is now primarily stock market futures content, though we do track heavily traded stocks and their likely daily trajectories as well – we begin at 9am with a morning report and likely chart movements along with trade setups for the day.
As long as the trader keeps himself aware of support and resistance levels, risk can be very adequately managed to play in either direction as bottom picking remains a behavior pattern that is developing with value buyers and speculative traders.
Twitter: @AnneMarieTrades
The author trades stock market futures every day and may have a position in mentioned securities at the time of publication. Any opinions expressed herein are solely those of the author, and do not in any way represent the views or opinions of any other person or entity.


