Stock Market Futures Considerations For June 29, 2017
Yesterday’s rally went further than many traders believed possible. The S&P 500 (INDEXSP:.INX) rallied nearly one percent but stretched even higher overnight as futures reached up near prior resistance (2448).
Check out today’s economic calendar with a full rundown of releases. And note that the charts below are from our premium service and shared exclusively with See It Market readers.
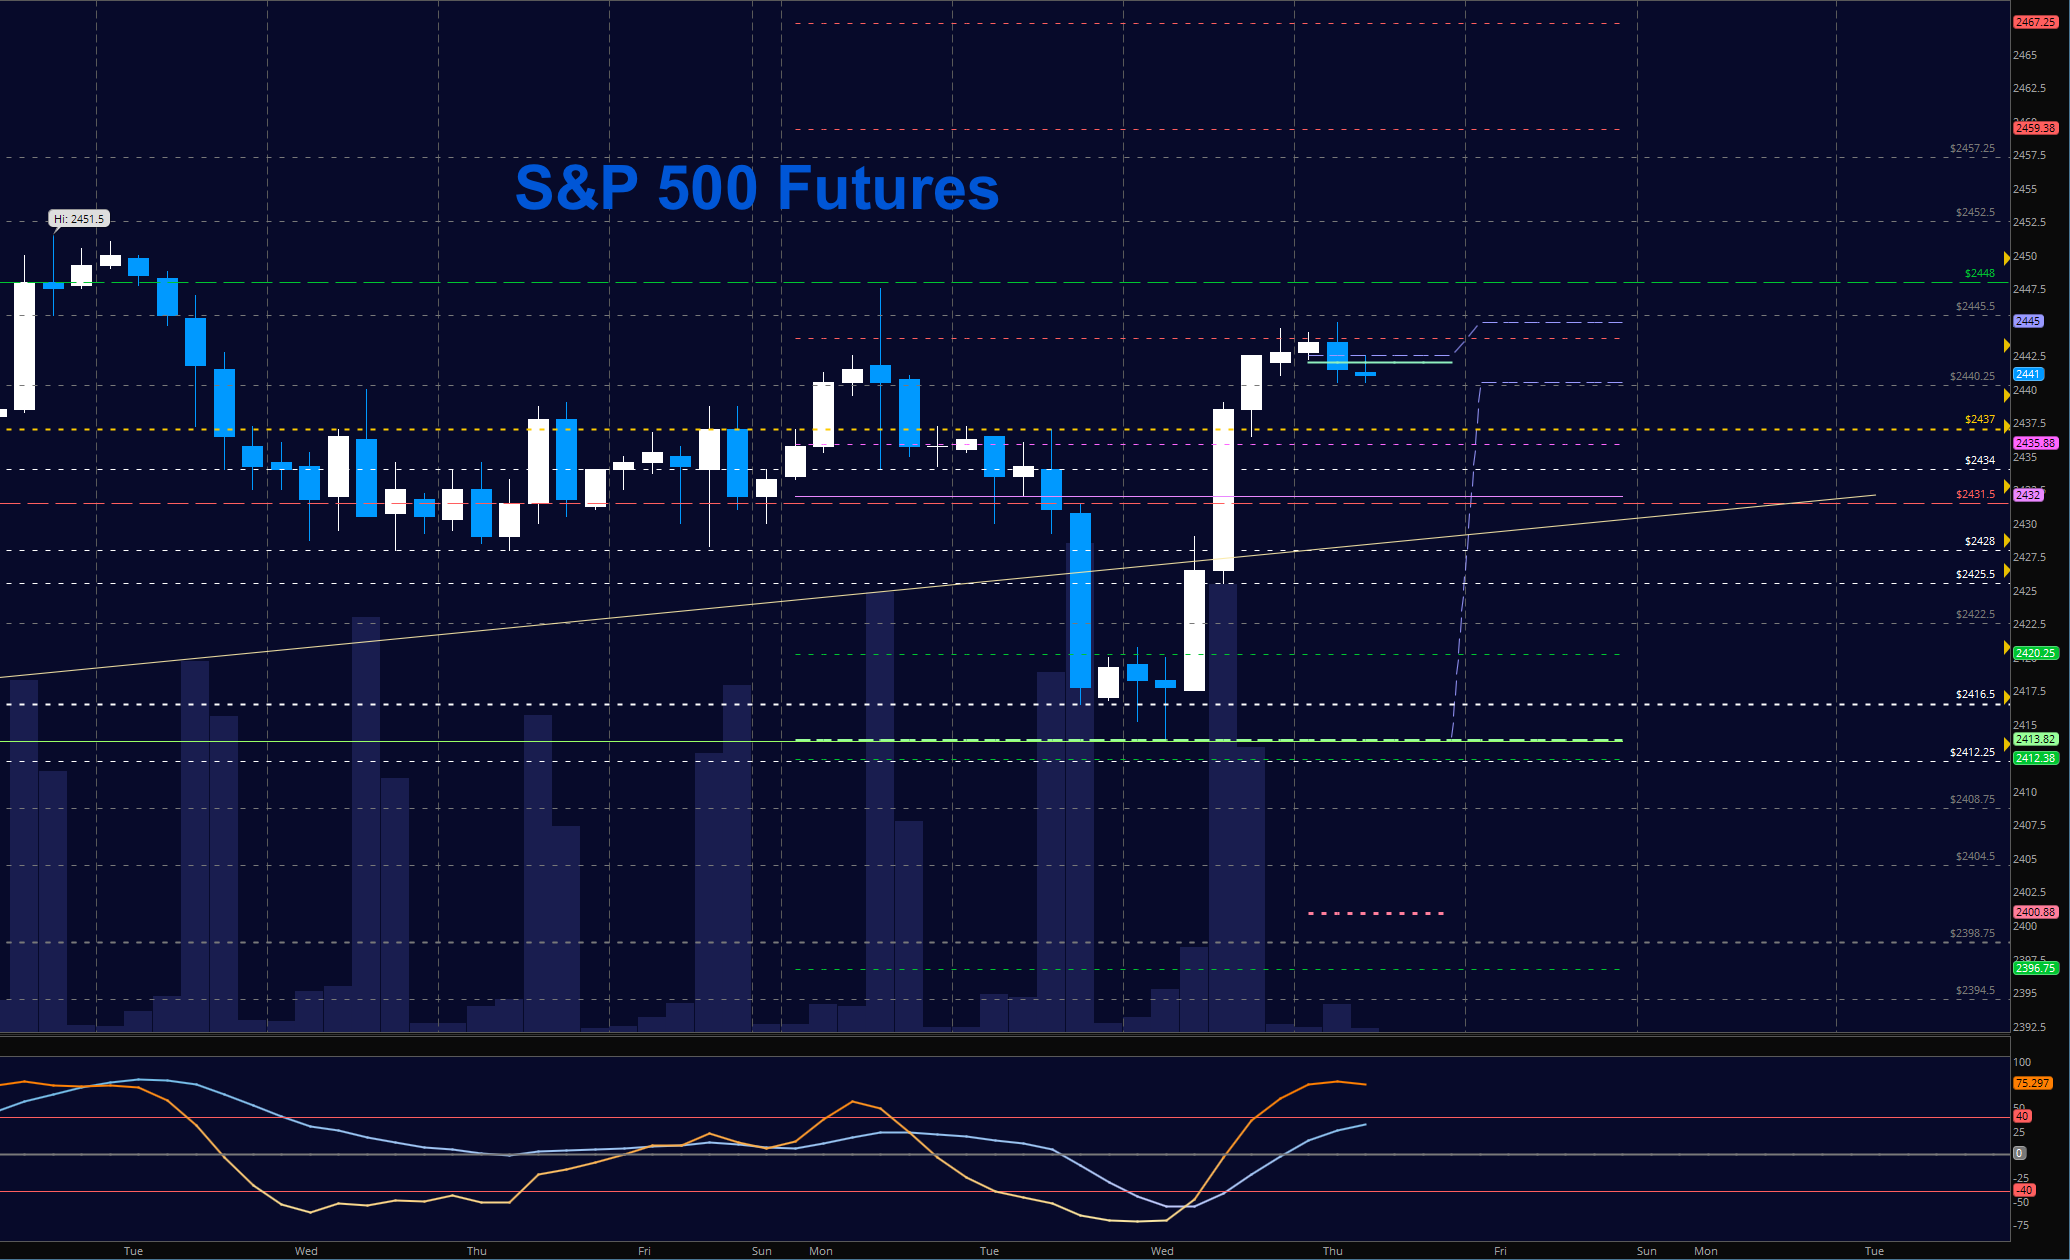
S&P 500 Futures (ES)
Yesterday’s relief bounce went well into the early morning, currently pausing just below prior resistance near 2448. Trading volume should lighten up over the next couple of days into the holiday next week. The bullets below represent the likely shift of trading momentum at the positive or failed retests at the levels noted.
- Buying pressure intraday will likely strengthen above a positive retest of 2446 (but resistance is nearby so use caution)
- Selling pressure intraday will likely strengthen with a failed retest of 2437
- Resistance sits near 2445.5 to 2448, with 2451.5 and 2454.5 above that.
- Support holds between 2440.5 and 2437.25, with 2431.75 and 2425.5 below that.
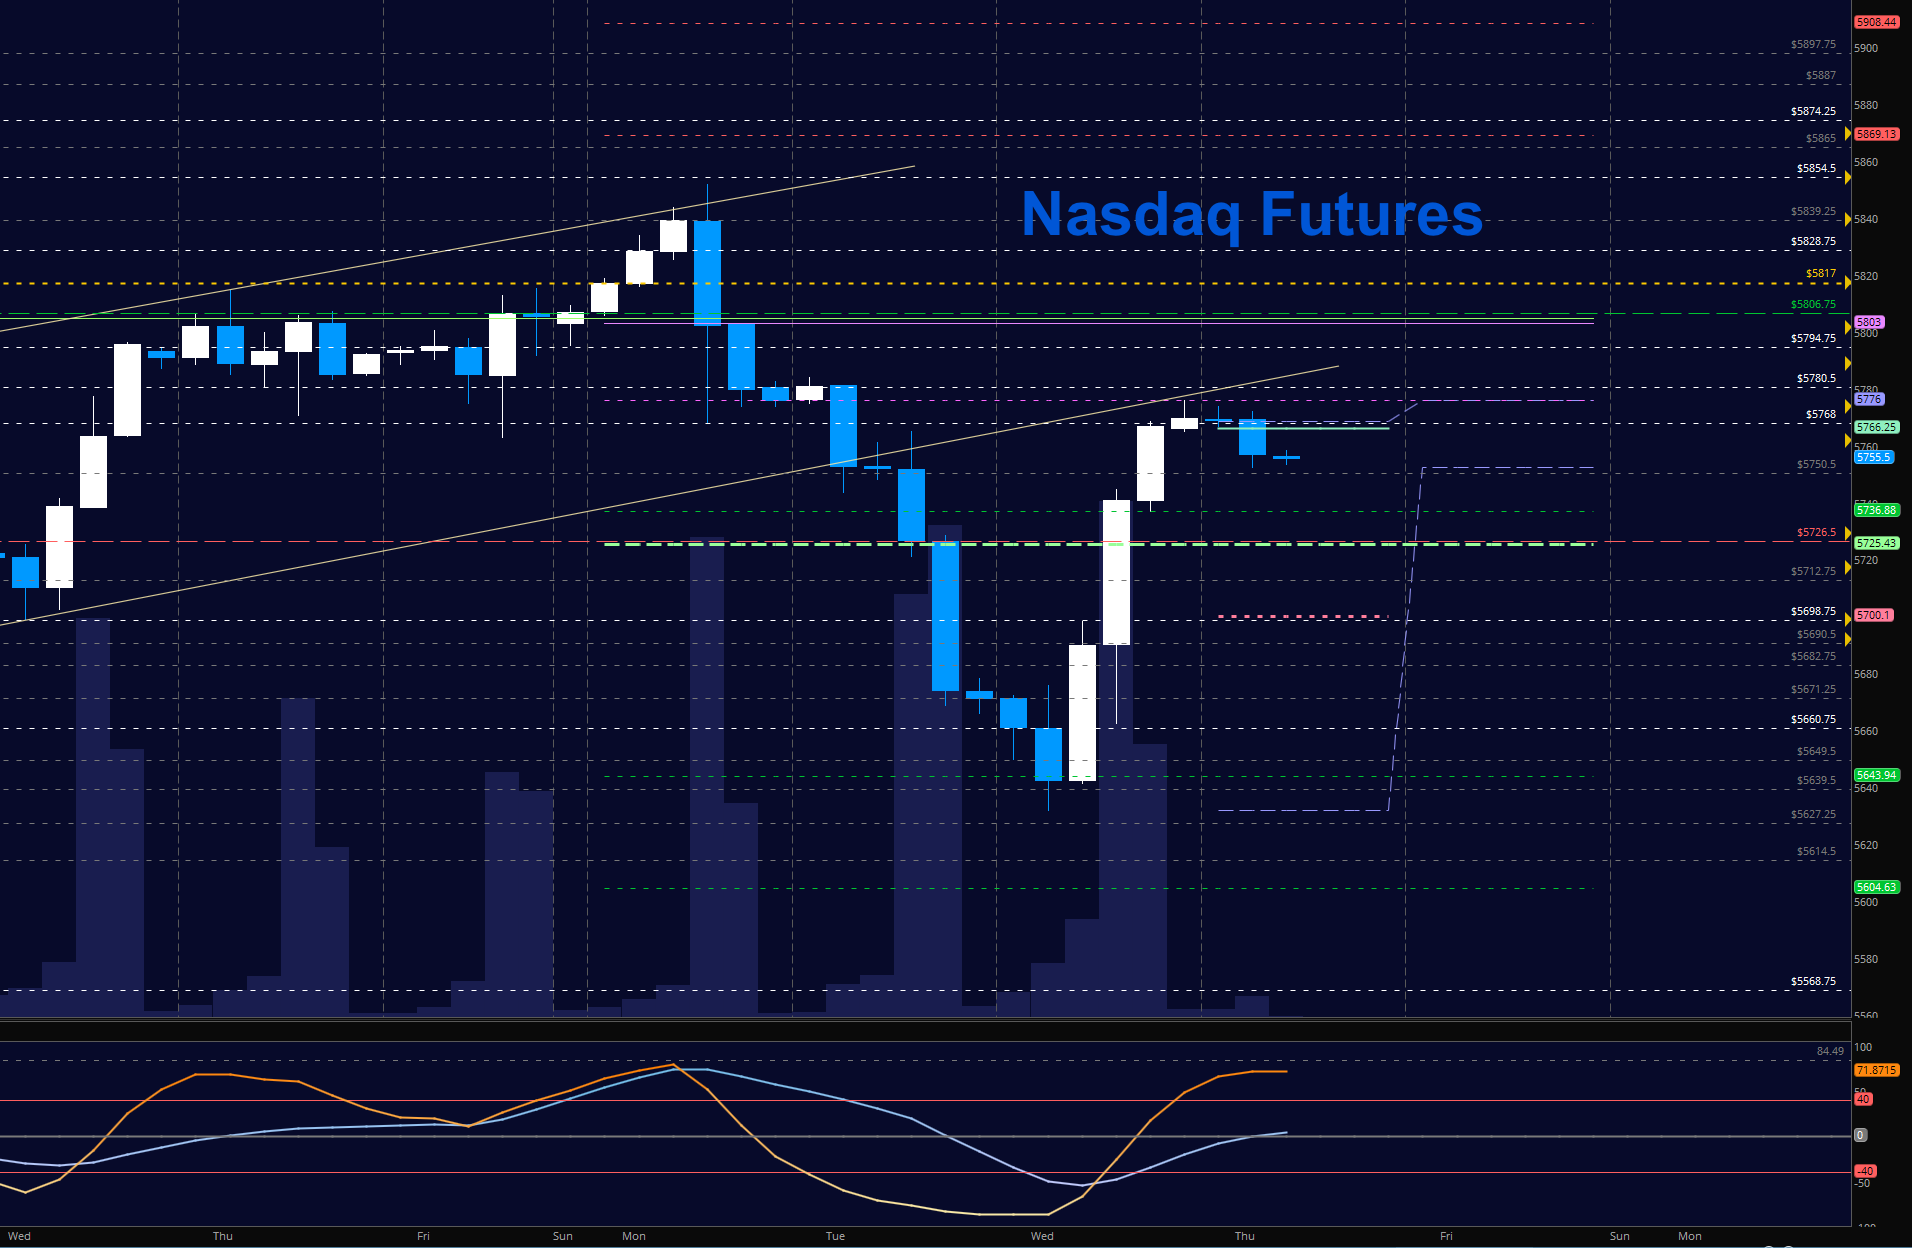
NASDAQ Futures (NQ)
As traders were rewarded once again by buying the deep dips, this chart rallied. But unlike the ES and YM, this one did not take out the highs of the early morning yesterday. As a result, I suspect that we are seeing developing weakness and a continuation of short positioning in this space. Buyers will need to defend 5746, and sellers will be standing near 5780 in an attempt to force price back down. The bullets below represent the likely shift of intraday trading momentum at the positive or failed tests at the levels noted.
- Buying pressure intraday will likely strengthen with a positive retest of 5780.5
- Selling pressure intraday will likely strengthen with a failed retest of 5726
- Resistance sits near 5776.75 to 5780.5, with 5806 and 5817.25 above that.
- Support holds between 5746.75 and 5726.75, with 5698.75 and 5660.5 below that.
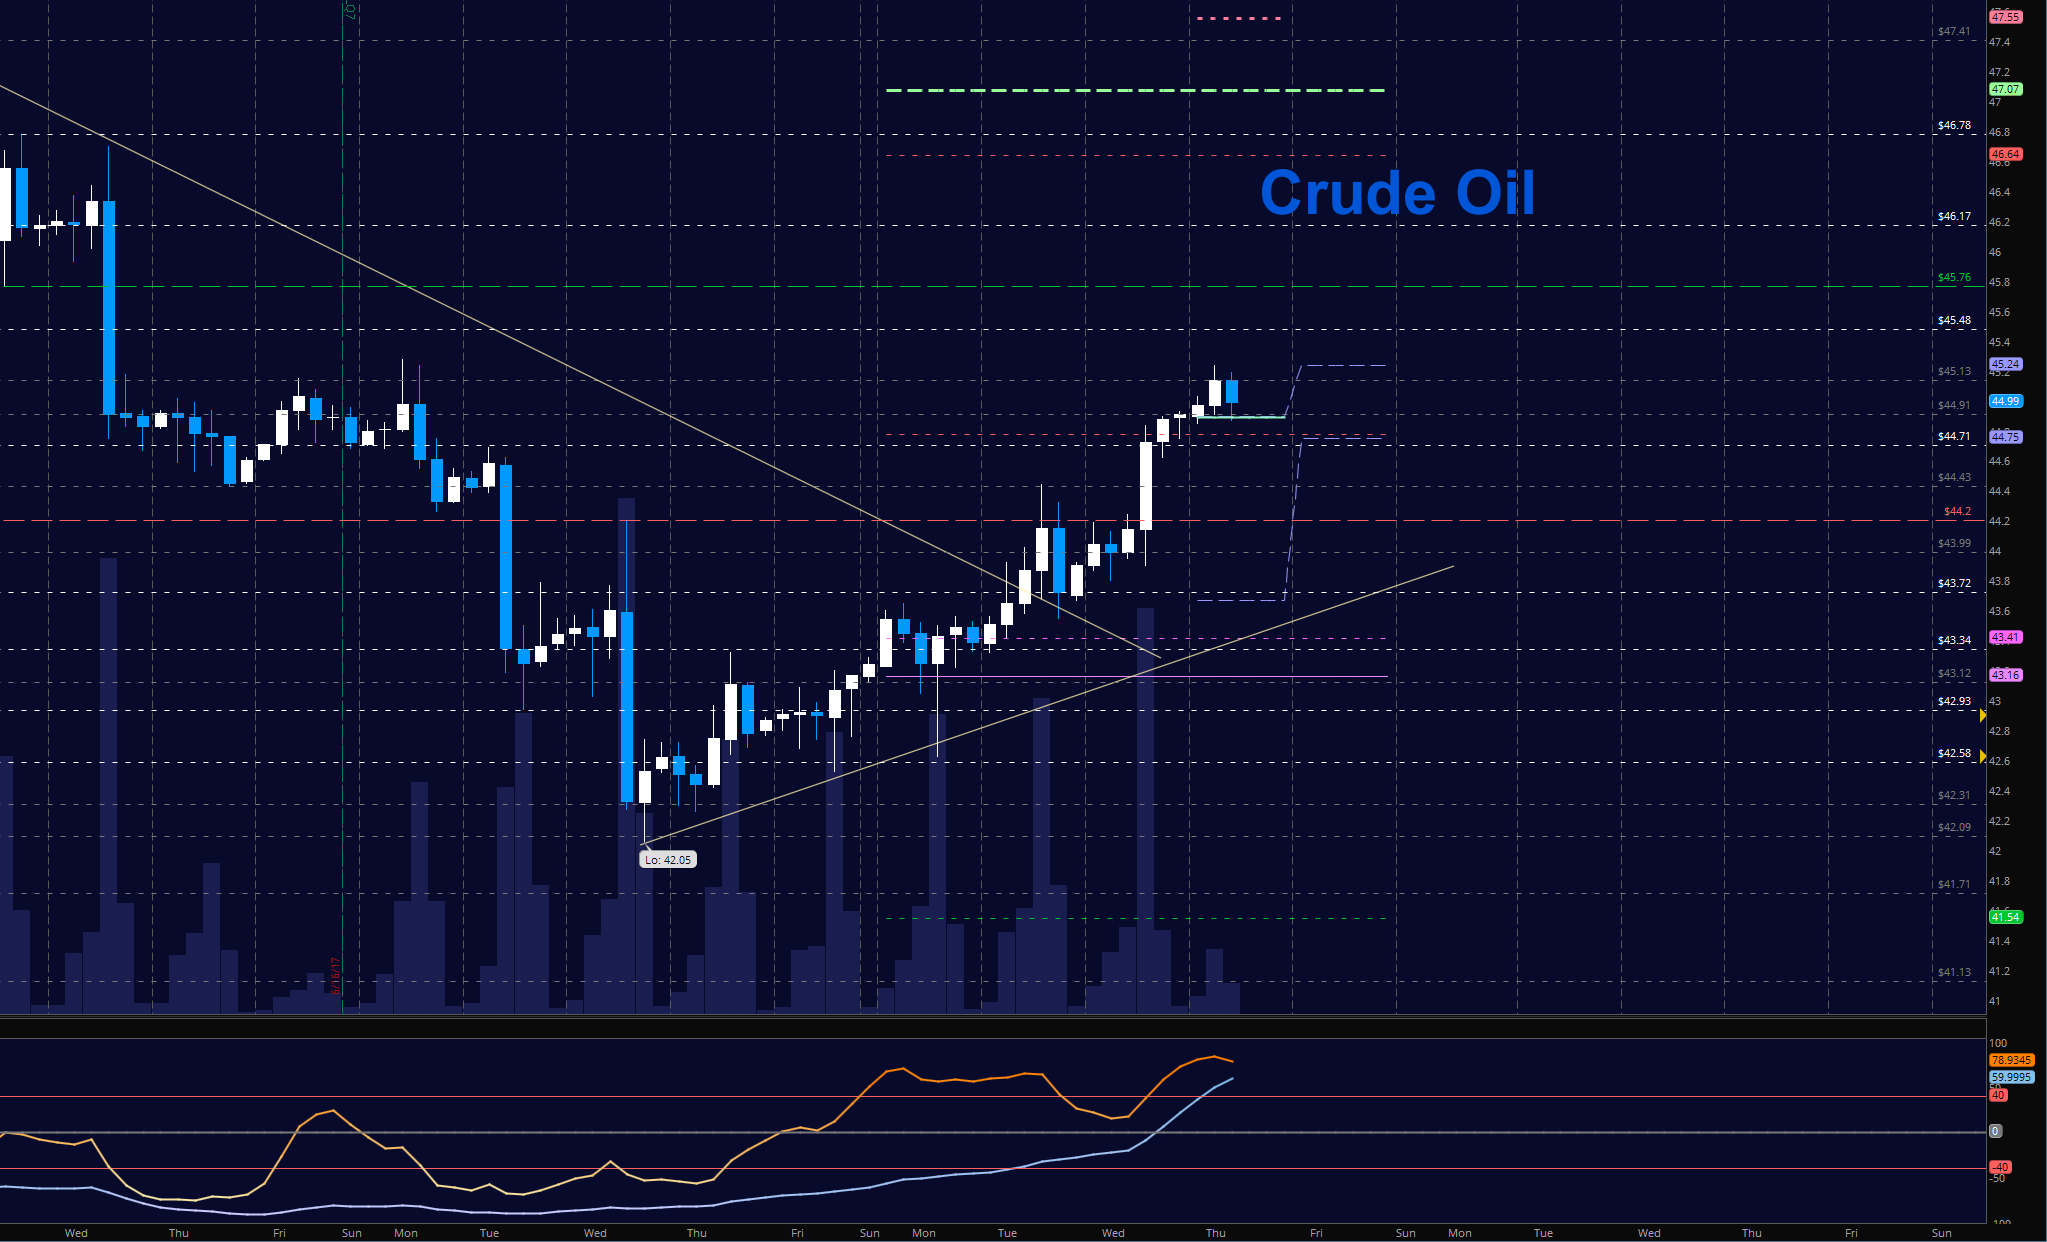
WTI Crude Oil
Buyers have ruled this chart for days and today we test the first region of significant breakdown before any more advances can be made. This level of resistance is 45.2, and above it sits 45.76 to 46.8. Support is now near 44.7, and formations still suggest that pullbacks will find buyers. The bullets below represent the likely shift of trading momentum at the positive or failed tests at the levels noted.
- Buying pressure intraday will likely strengthen with a positive retest of 45.25
- Selling pressure intraday will strengthen with a failed retest of 44.6
- Resistance sits near 45.24 to 45.49, with 45.68 and 46.4 above that.
- Support holds between 44.6 to 44.4, with 44.22 and 43.7 below that.
If you’re interested in watching these trades go live, join us in the live trading room from 9am to 11:30am each trading day. Visit TheTradingBook for more information.
If you’re interested in the live trading room, it is now primarily stock market futures content, though we do track heavily traded stocks and their likely daily trajectories as well – we begin at 9am with a morning report and likely chart movements along with trade setups for the day.
As long as the trader keeps himself aware of support and resistance levels, risk can be very adequately managed to play in either direction as bottom picking remains a behavior pattern that is developing with value buyers and speculative traders.
Twitter: @AnneMarieTrades
The author trades stock market futures every day and may have a position in mentioned securities at the time of publication. Any opinions expressed herein are solely those of the author, and do not in any way represent the views or opinions of any other person or entity.


")

 Ready To Break Out?")

