Stock Market Futures Trading Considerations For January 30, 2017
Most of our FOMC weeks have logged a bit of movement, and this week should be no different. Expecting a bit of hawkishness expected as it relates to interest rates on the rise as their employment watchpoints are in line with expectations. A large number of voices are speaking about the market getting ahead of itself with optimism a bit high, so there should be wicks on either side of our ranges. If you look at the language from Friday’s post, I said – “A new high was set yesterday and as long as we hold 2290, we should keep upside power. The failed retest of this support should bring us into deeper support near 2287.5, and 2282.5” (on S&P 500 futures) – this is where we are right now after bouncing off 2281. Selling pressure will increase at the loss of 2275 – resistance now sitting above 2290 and into 2297.5 on the S&P 500 (INDEXSP:.INX).
Buying pressure will likely strengthen above a positive retest of 2287.5, while selling pressure will strengthen with a failed retest of 2275.5. Price resistance sits near 2287.5 to 2294.25, with 2297.5 and 2301.75 above that. Price support holds between 2281- 2277.50, with 2275.5 and 2271.5 below that
See today’s economic calendar with a rundown of releases.
TODAY’S RANGE OF MOTION
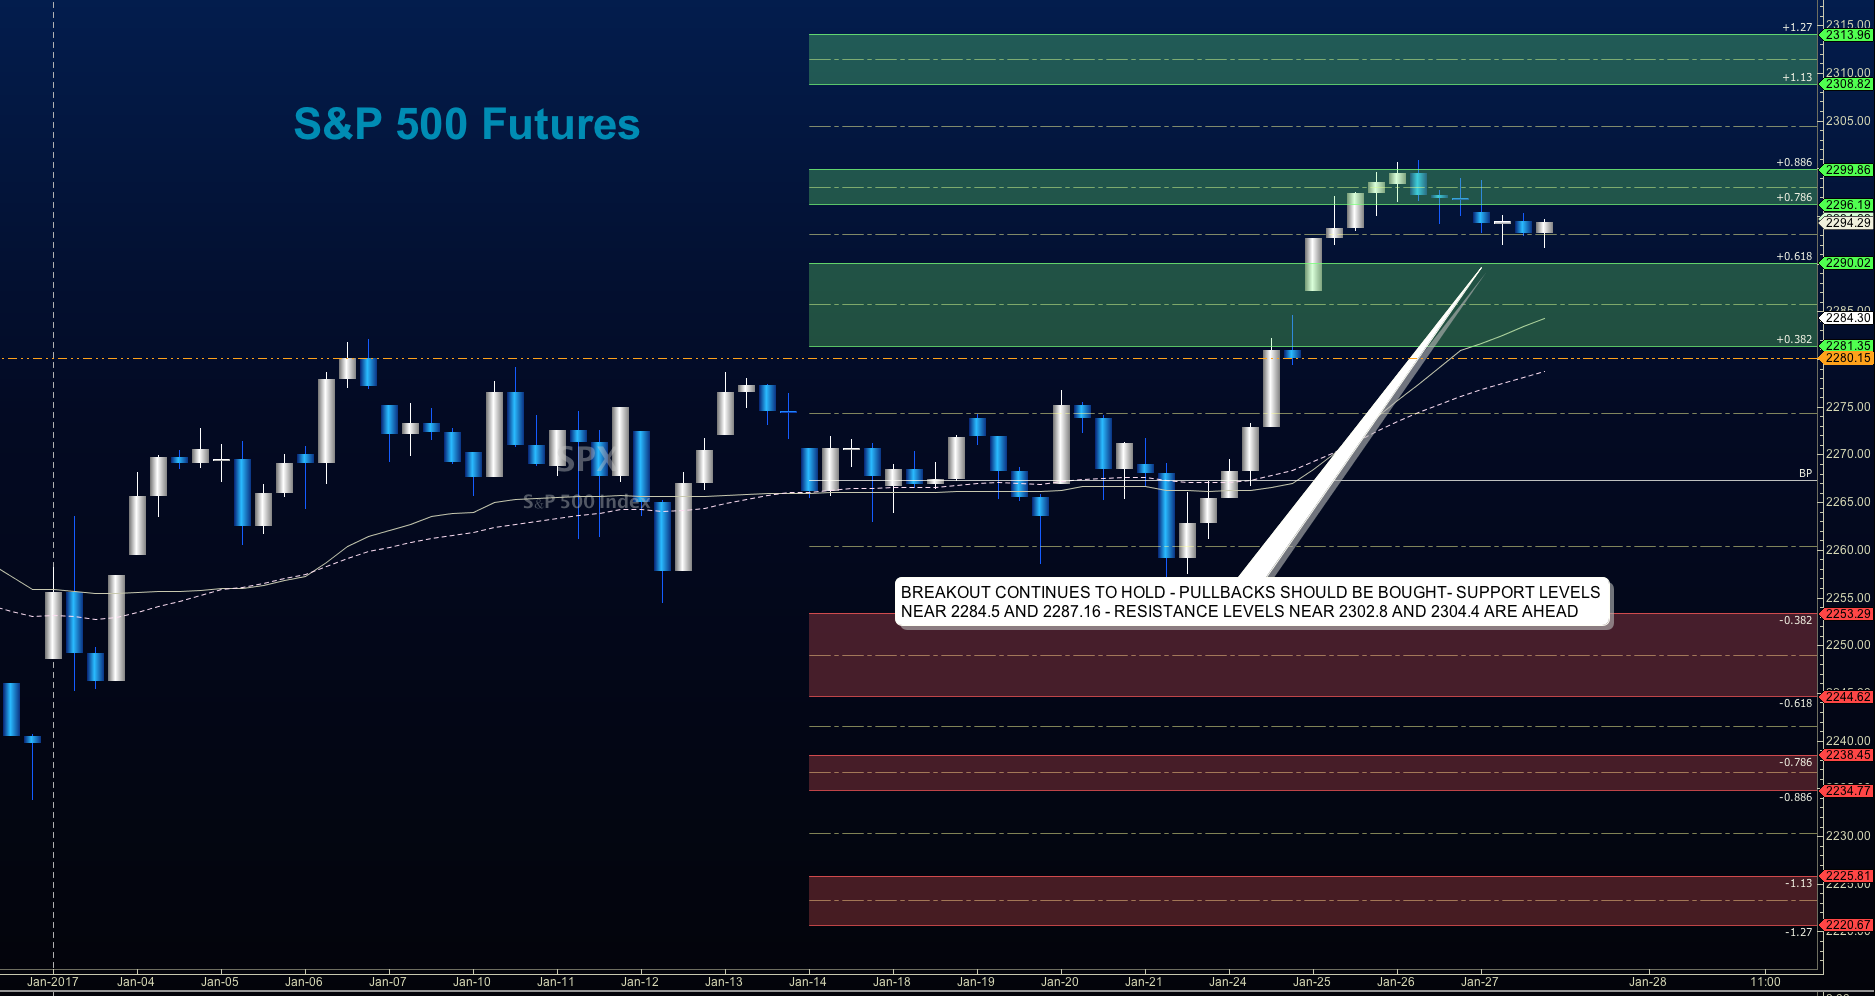
E-mini S&P 500 Futures Trading For January 27
Upside trades – Two options for entry
- Positive retest of continuation level -2287.25 ( watch for sellers near 2291 and 2294)
- Positive retest of support level– 2284.25 ( watch also for a solid retest at 2281.25)
- Opening targets ranges – 2287.5, 2291.5, 2294.25, 2297.25, 2299.5, 2301.75, 2303.5, 2306.75, 2309.75, 2313.5 and 2320
Downside trades – Two options for entry
- Failed retest of resistance level -2284
- Failed retest of support level– 2281
- Opening target ranges – 2281.5, 2278.25, 2275, 2271.5, 2268.75, 2264.5 and 2261.5
Nasdaq Futures
The NQ_F chart holds a range bound formation with levels much like Fridays with a gap down into support levels that are currently holding. As long as support levels near 5140 hold, we are still under bullish formations. Some important stocks in the NQ_F report over the next week and could drive this chart quite a bit higher if expectations of performance are met in these stocks.
Buying pressure will likely strengthen with a positive retest of 5163.75, while selling pressure will strengthen with a failed retest of 5139.25. Price resistance sits near 5163.25 to 5168.5, with 5173.5 and 5178.75 above that. Price support holds between 5147.5 and 5140.5, with 5130.75 and 5122.75 below that
Upside trades – Two options
- Positive retest of continuation level -5154.5 ( watch 5163 for sellers)
- Positive retest of support level– 5146.5
- Opening target ranges – 5149.5, 5155.75, 5158.75, 5162.5, 5166, 5168.5, 5773.5, 5178.75, 5183.5, and 5188.25
Downside trades- Two options
- Failed retest of resistance level -5154.5
- Failed retest of support level– 5139.25
- Opening target ranges –5150.5, 5146.5, 5143.5, 5139.25, 5132.75, 5126.5, 5122.75, 5117.75, 5113.75, 5109.5, 5103.75, and 5098.7
Crude Oil –WTI
After a fade on Friday, oil has held early morning support near 52.8 as traders continue to anticipate a tightening of supply. As Libya increases its output along with the U.S., it remains to be seen if oil can break through the channel that has been holding for a couple of months.
Buying pressure will likely strengthen with a positive retest of 53.87, while selling pressure will strengthen with a failed retest of 52.56. Price resistance sits near 53.87 to 54.06, with 54.28 and 54.51 above that. Price support holds between 53.23 and 53.03, with 52.78 and 52.04 below that.
Upside trades – Two options
- Positive retest of continuation level -53.26 ( watch for sellers near 53.46 and 53.67)
- Positive retest of support level– 52.94 (watch for sellers near 53.26 – 53.46)
- Opening target ranges – 53.04, 53.24, 53.46, 53.86, 54.16, 54.28, 54.51, 54.76, 55.06, and 55.24
Downside trades- Two options
- Failed retest of resistance level -53.67 ( watch for buyers near 53.46 and 53.23)
- Failed retest of support level– 53.2 (watch for buyers near 52.78 – 52.8)
- Opening target ranges –53.46, 53.23, 53.04, 52.78, 52.56, 52.28, 52.08, 51.78, 51.52, 51.24, 51.04, 50.82, 50.47, 50.3, and 50.16
If you’re interested in watching these trades go live, join us in the live trading room from 9am to 11:30am each trading day.
Visit TheTradingBook for more information.
If you’re interested in the live trading room, it is now primarily stock market futures content, though we do track heavily traded stocks and their likely daily trajectories as well – we begin at 9am with a morning report and likely chart movements along with trade setups for the day.
As long as the trader keeps himself aware of support and resistance levels, risk can be very adequately managed to play in either direction as bottom picking remains a behavior pattern that is developing with value buyers and speculative traders.
Twitter: @AnneMarieTrades
The author trades stock market futures every day and may have a position in mentioned securities at the time of publication. Any opinions expressed herein are solely those of the author, and do not in any way represent the views or opinions of any other person or entity.

: Showing Some Signs of Emerging Strength")
