Stock Market Outlook for December 13, 2016 –
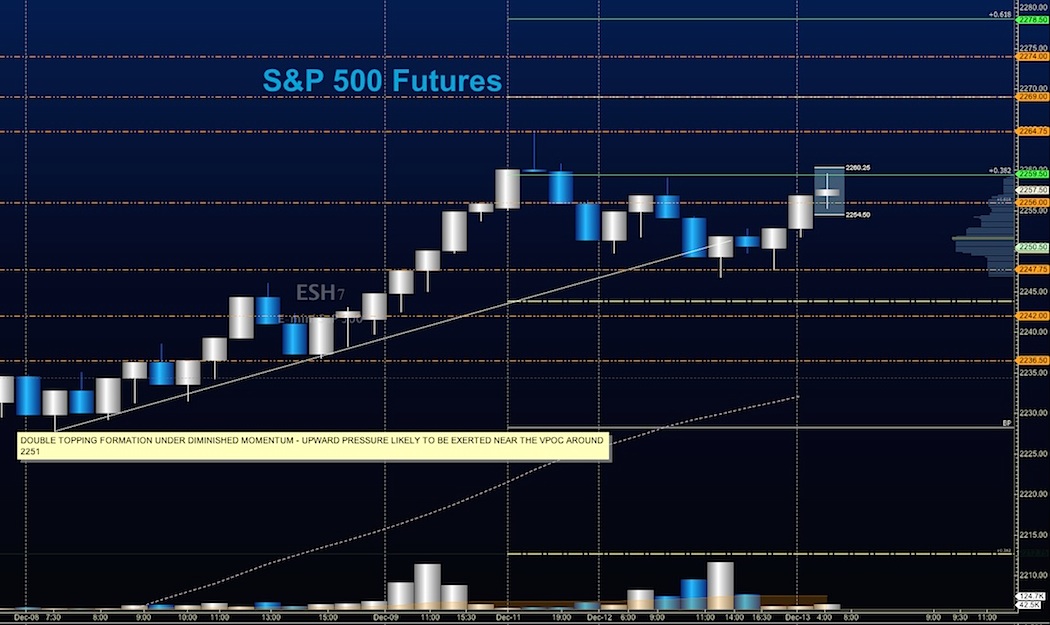
S&P 500 Futures are still below its high of 2264.75 but appears to be setting up for a retest. After a quiet day yesterday, charts for the S&P 500 (INDEXSP:.INX) are resuming the upward march in the drift up into the FOMC release tomorrow. The line in the sand for buyers to hold today will be 2251, and below that, 2247. Price support levels to watch below there are 2240.75-2236.75. Price resistance holds at 2264.75 at this writing. Fibonacci extensions show 2270.50 and 2278 as potential upside targets. Buyers continue to come in at support to hold price steady.
See today’s economic calendar with a rundown of releases.
TODAY’S RANGE OF MOTION
S&P 500 Futures Trading Outlook – December 13
Upside trades – Two options for entry –
Positive retest of continuation level – 2256.75
Positive retest of support level – 2251.5
Opening targets ranges – 2253.75, 2256, 2260.50, 2263.75, 2267.75, 2270.25, 2275.50, and 2278.25
Downside trades – Two options for entry –
Failed retest of resistance level -2254.25
Failed retest of support level– 2250.50
Opening target ranges – 2251.5, 2249.50, 2246.50, 2241.25, 2237.75, 2234.75, 2231.50, 2227.75, 2224.25, and 2224.25
Nasdaq Futures
The NQ_F has also resumed its upward drift into the FOMC release. The level buyers will need to hold is 4860, or risk a drift down to 4851.75 and 4842 after that. Momentum is positive but drifting. Resistance still holds near 4896 to 4888, but a breach there could send us back to 4916.50, 4921, and 4929.
Upside trades – Two options
Positive retest of continuation level – 4886.50
Positive retest of support level – 4865.50
Opening target ranges – 4869.50, 4870.75, 4876, 4880, 4884.75, 4890.25, 4894.50, 4900.25, 4905.25, 4916, 4919.75, and potentially 4929.25
Downside trades – Two options
Failed retest of resistance level – 4879.50
Failed retest of support level – 4872.50
Opening target ranges – 4876.25, 4870.25, 4863.75, 4859.75, 4854.75, 4847.50, 4844.50, 4840.25, 4836.50, and 4836.50
Crude Oil – WTI
Higher lows are still present on larger time frames, and resistance sits at 54.04 to 54.5 today. Traders are holding the gap unfilled between 51.48 and 52.48 at this time, as buyers continue to find support near 52.40. The API report is due to be released after the close today
Upside trades – Two options
Positive retest of continuation level – 53.56
Positive retest of support level -52.83
Opening target ranges – 53.03, 53.41, 53.8, 54.04, 54.21, 54.5, 54.97, and 55.4
Downside trades – Two options
Failed retest of resistance level – 53.4
Failed retest of support level– 52.8 – (watch for support at 52.47)
Opening target ranges – 53.04, 52.86, 52.5, 52.34, 52.14, 51.89, 51.64, 51.47, 50.27, 50.13, 49.87, and 49.6
If you’re interested in the live trading room, it is now primarily stock market futures content, though we do track heavily traded stocks and their likely daily trajectories as well – we begin at 9am with a morning report and likely chart movements along with trade setups for the day.
As long as the trader keeps himself aware of support and resistance levels, risk can be very adequately managed to play in either direction as bottom picking remains a behavior pattern that is developing with value buyers and speculative traders.
Twitter: @AnneMarieTrades
The author trades stock market futures every day and may have a position in mentioned securities at the time of publication. Any opinions expressed herein are solely those of the author, and do not in any way represent the views or opinions of any other person or entity.


 Ready To Break Out?")