Stock Market Futures Considerations For August 9, 2017
The S&P 500 (INDEXSP:.INX) saw a sharp reversal intraday yesterday and is seeing some follow through today. Below are key futures trading prices for the S&P 500, Nasdaq, and crude oil.
Check out today’s economic calendar with a full rundown of releases. And note that the charts below are from our premium service and shared exclusively with See It Market readers.
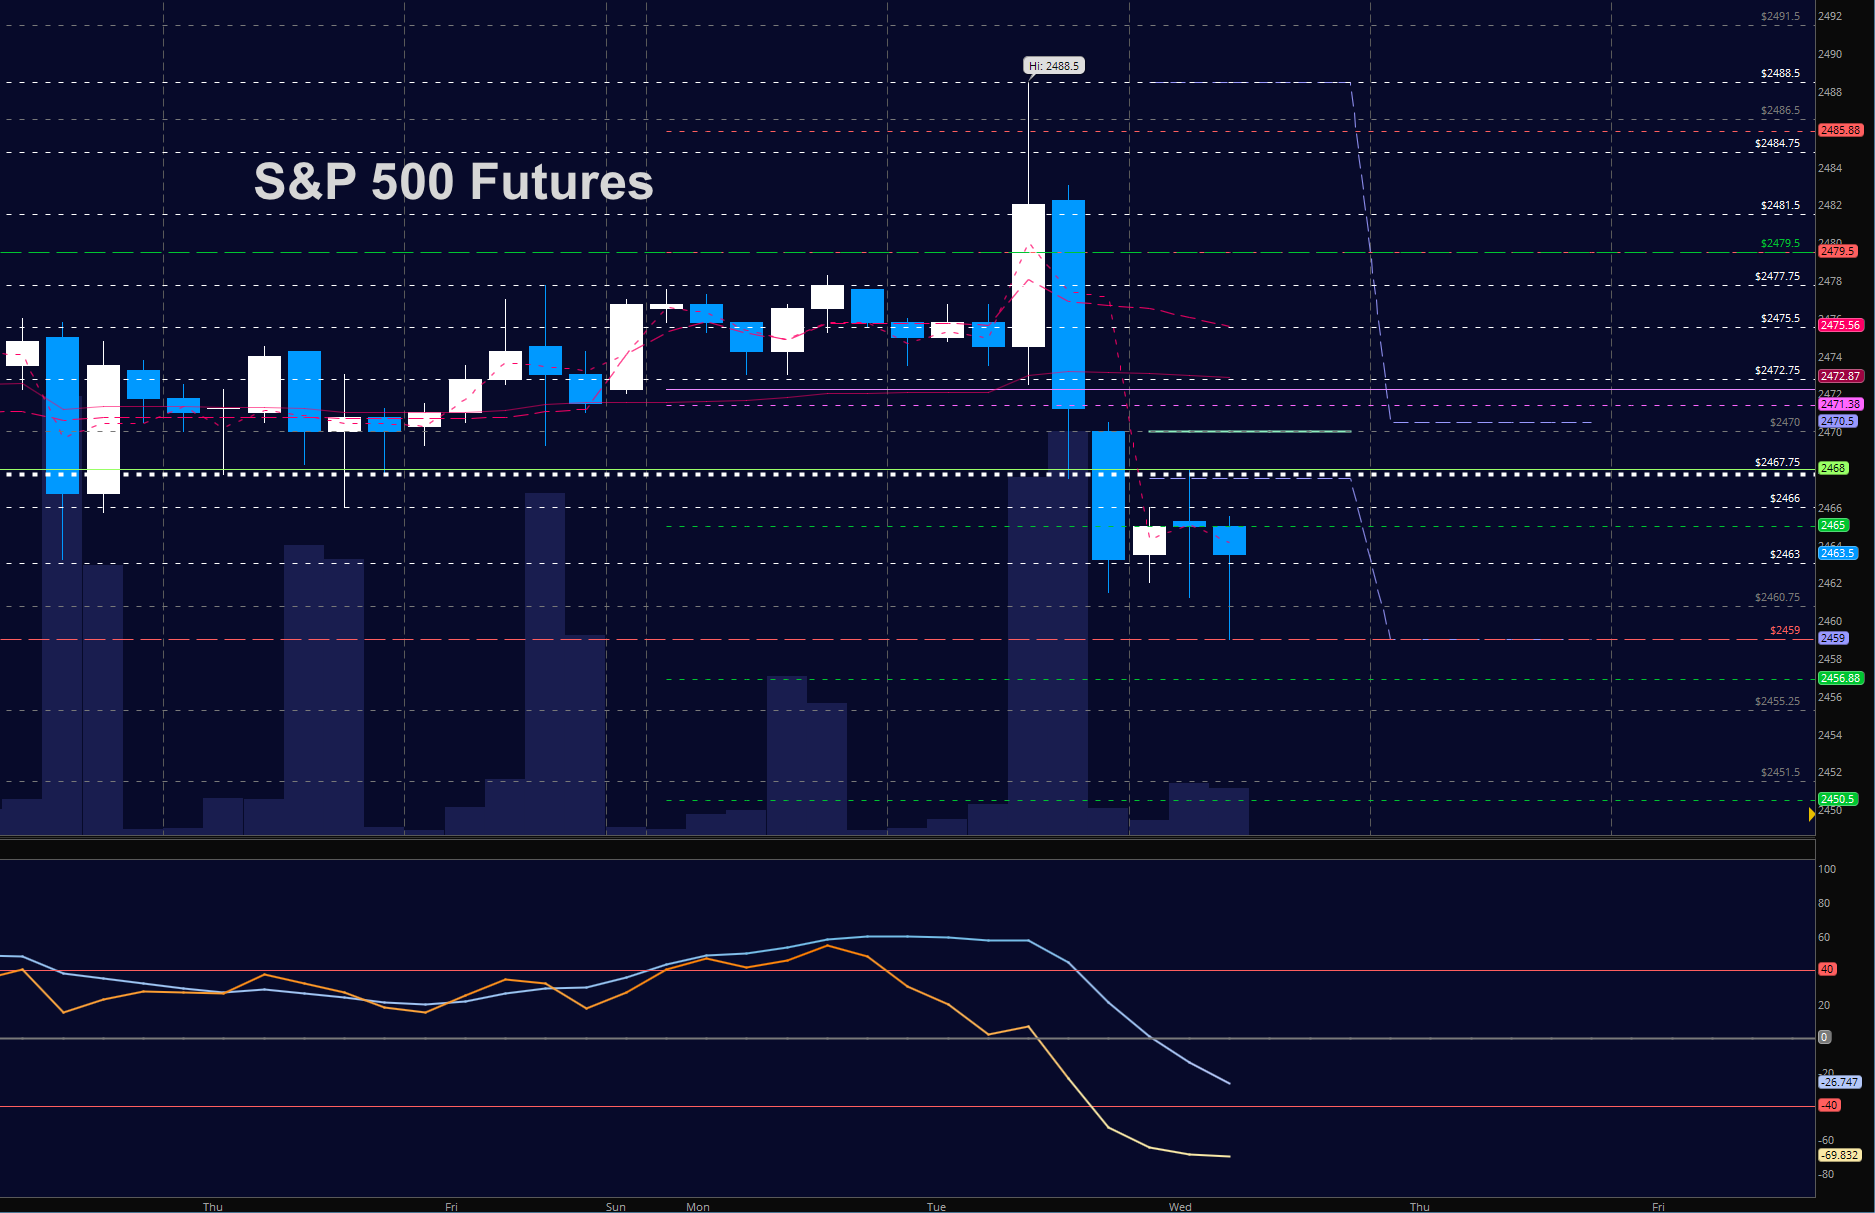
S&P 500 Futures (ES)
A move likely created by a short squeeze created an area of thinner volume that provided no real support to buyers. This allowed for selling to continue in the opposite direction into the close. Use caution and go with the flow instead of trying to pick tops and bottoms. On top of this, we have war and conflict rhetoric all around making for additional unsettled environments. Support now sits near 2459. Resistance is now near 2475.5 to 2478. Charts are range bound between 2463 and 2466. The bullets below represent the likely shift of trading momentum at the positive or failed retests at the levels noted.
- Buying pressure intradaywill likely strengthen above a positive retest of 2468 (careful again here with resistance as momentum is bearish)
- Sellingpressure intraday will likely strengthen with a failed retest of 2463
- Resistance sits near 2470.5 to 2472.5, with 2475.75 and 2478 above that.
- Support holds between 2459 and 2456.75, with 2451.5 and 2449.75 below that.
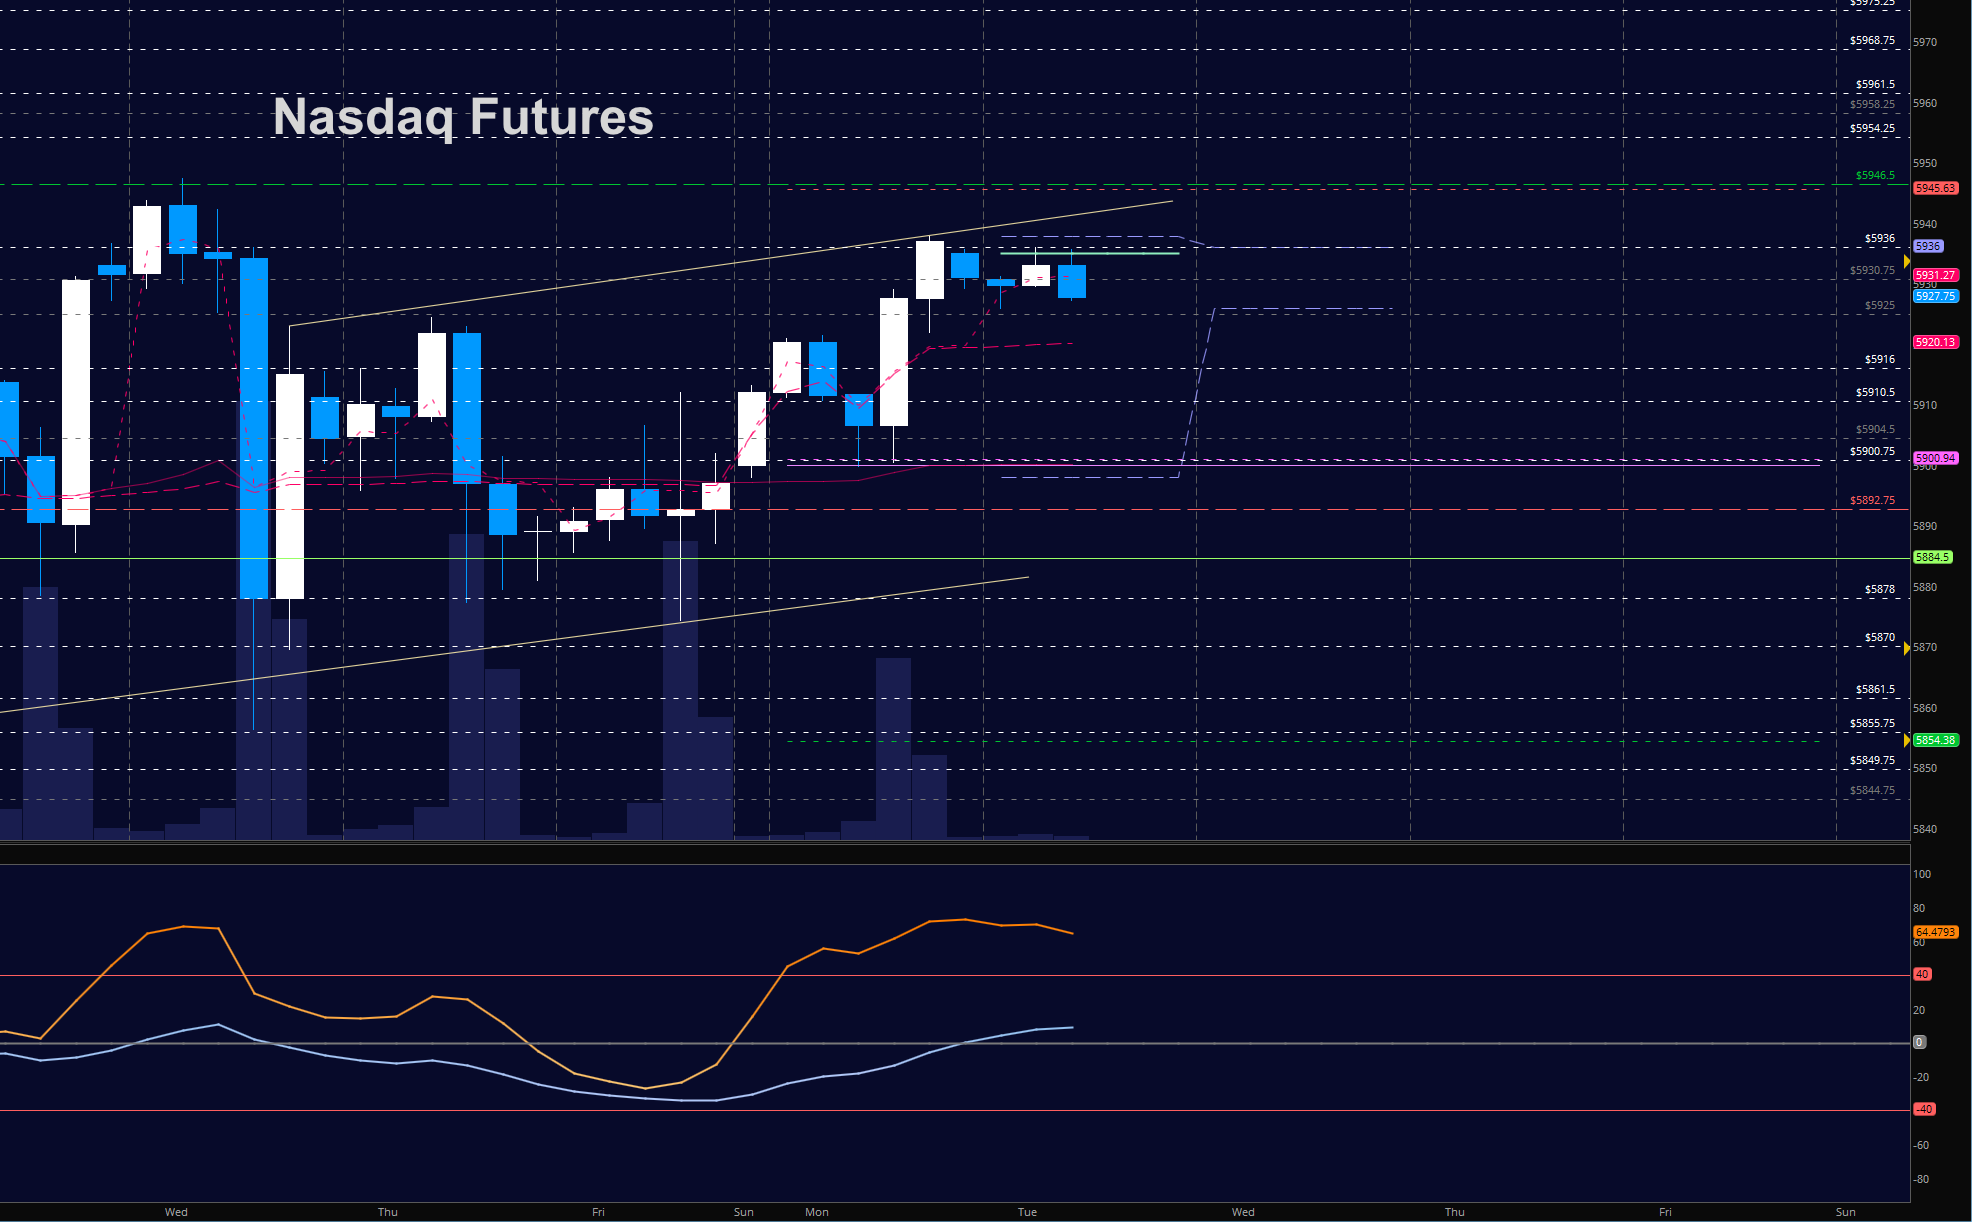
NASDAQ Futures (NQ)
As with the ES_F, it is likely that the upward move was created by short covering – leaving a vacuum of support and allowing charts to fade into deeper regions of support. Deeper support levels are now being tested and decisions near the monthly open of 5884 will be important to hold. Resistance sits near 5900 and then above at 5906.5. Momentum is now a bit negative on tighter time frames. The bullets below represent the likely shift of intraday trading momentum at the positive or failed tests at the levels noted.
- Buyingpressure intraday will likely strengthen with a positive retest of 5907
- Sellingpressure intraday will likely strengthen with a failed retest of 5873
- Resistance sits near 5900.75 to 5906.5, with 5913.5 and 5929.5 above that.
- Support holds between 5880.25 and 5873.5, with 5868.5 and 5855.5 below that.
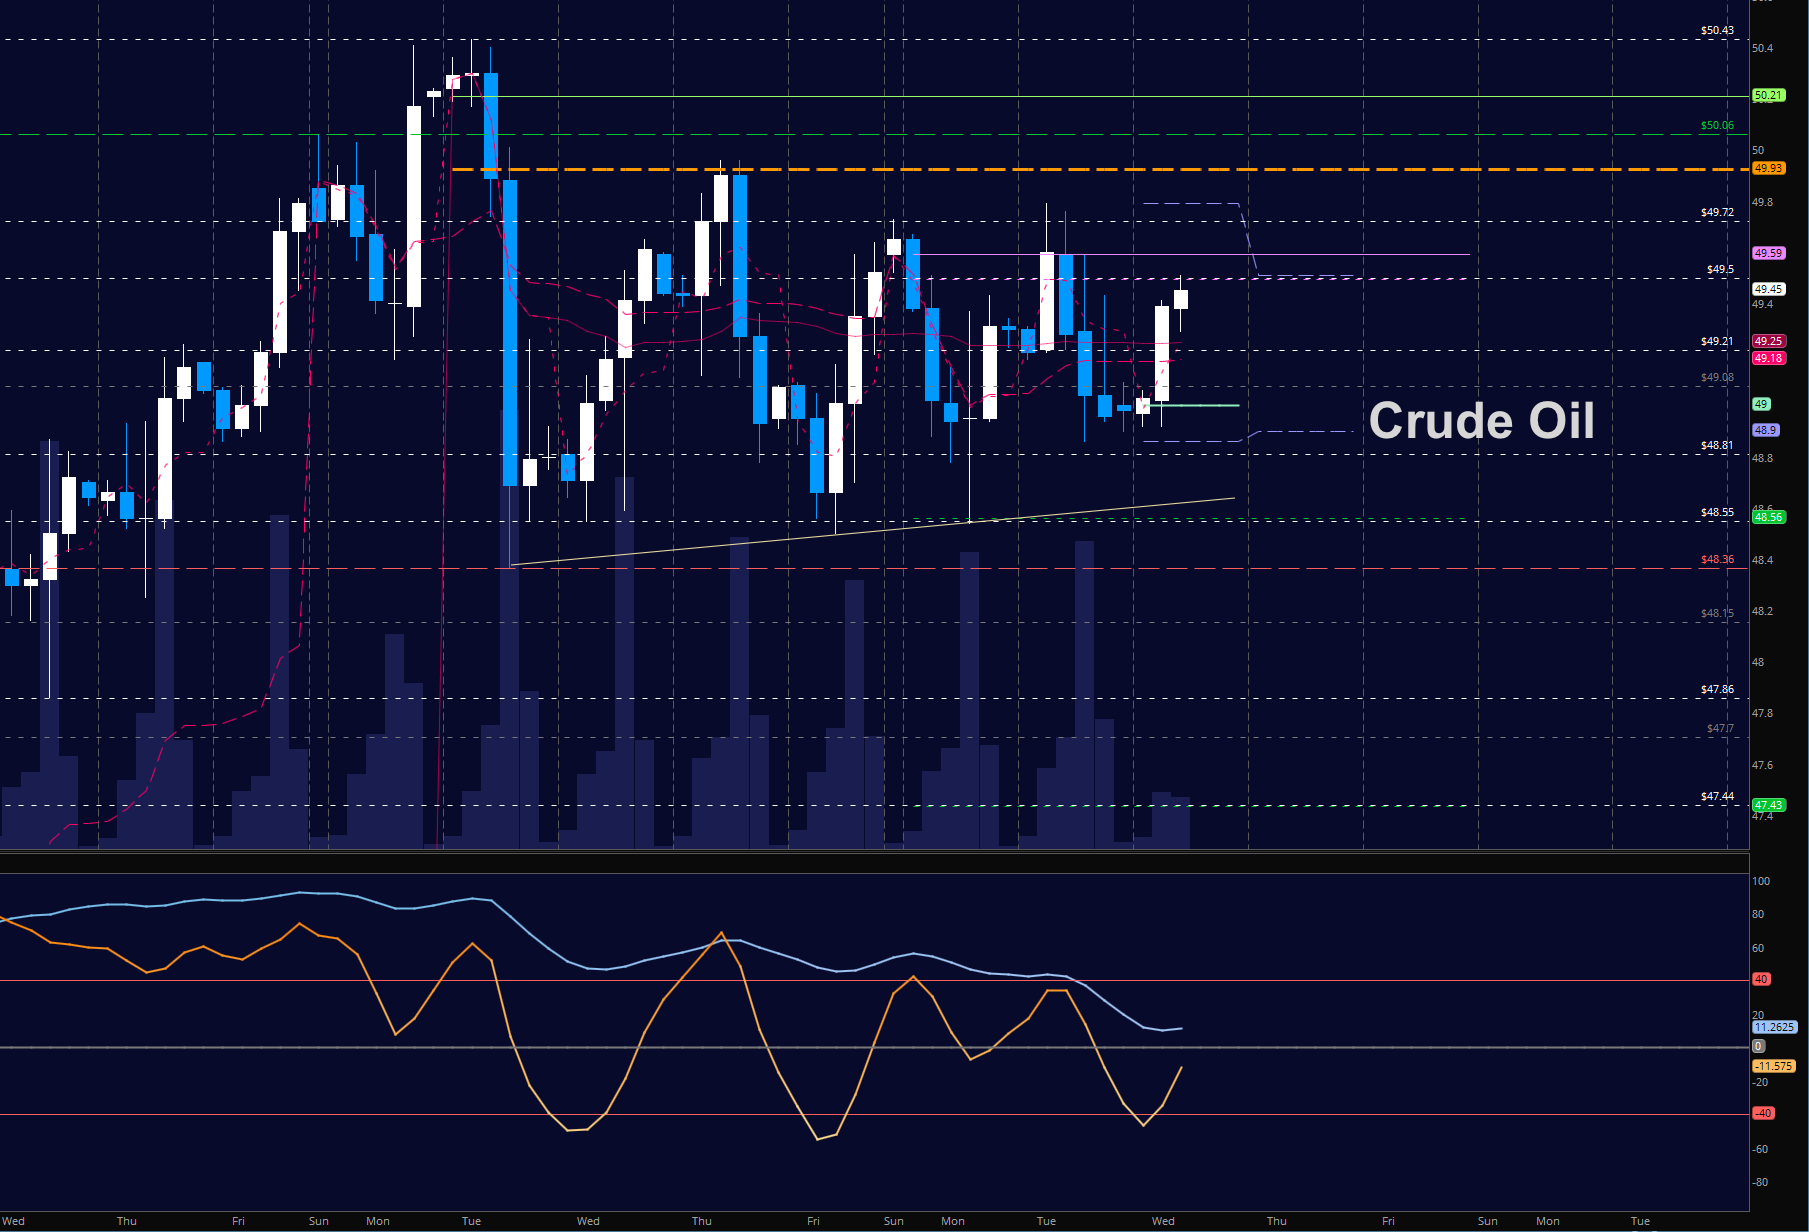
WTI Crude Oil
EIA report today as price action continues in a jagged formation requiring swift entry and exit behavior as traders. Higher lows and lower highs hold this chart in largely bullish formations as traders battle with our 48.80 support levels daily. Deep pullbacks will continue to hold regions for buyers to engage in the current formation – and large spikes up will bring sellers out as well. Momentum is mixed. We held 48.9 as support yesterday. Buyers remain in greater control above 49.27 but will come out to secure their leverage at deep pullbacks. Sellers sit near 49.8 resistance of yesterday. The bullets below represent the likely shift of trading momentum at the positive or failed tests at the levels noted.
- Buyingpressure intraday will likely strengthen with a positive retest of 49.83
- Sellingpressure intraday will strengthen with a failed retest of 48.55
- Resistance sits near 49.79 to 49.95, with 50.12 and 50.41 above that.
- Support holds between 49.18 to 49.02, with 48.9 and 48.55 below that.
If you’re interested in the live trading room, it is now primarily stock market futures content, though we do track heavily traded stocks and their likely daily trajectories as well – we begin at 9am with a morning report and likely chart movements along with trade setups for the day.
As long as the trader keeps himself aware of support and resistance levels, risk can be very adequately managed to play in either direction as bottom picking remains a behavior pattern that is developing with value buyers and speculative traders.
Twitter: @AnneMarieTrades
The author trades stock market futures every day and may have a position in mentioned securities at the time of publication. Any opinions expressed herein are solely those of the author, and do not in any way represent the views or opinions of any other person or entity.


