Stock Market Futures Trading Outlook For August 8, 2017
The S&P 500 (INDEXSP:.INX) is trading slightly lower and crude oil is off the mark. But it’s early in the day so traders will want to stay focused on their trading pivots and levels. Below are key futures trading prices for the S&P 500, Nasdaq, and crude oil.
Check out today’s economic calendar with a full rundown of releases. And note that the charts below are from our premium service and shared exclusively with See It Market readers.
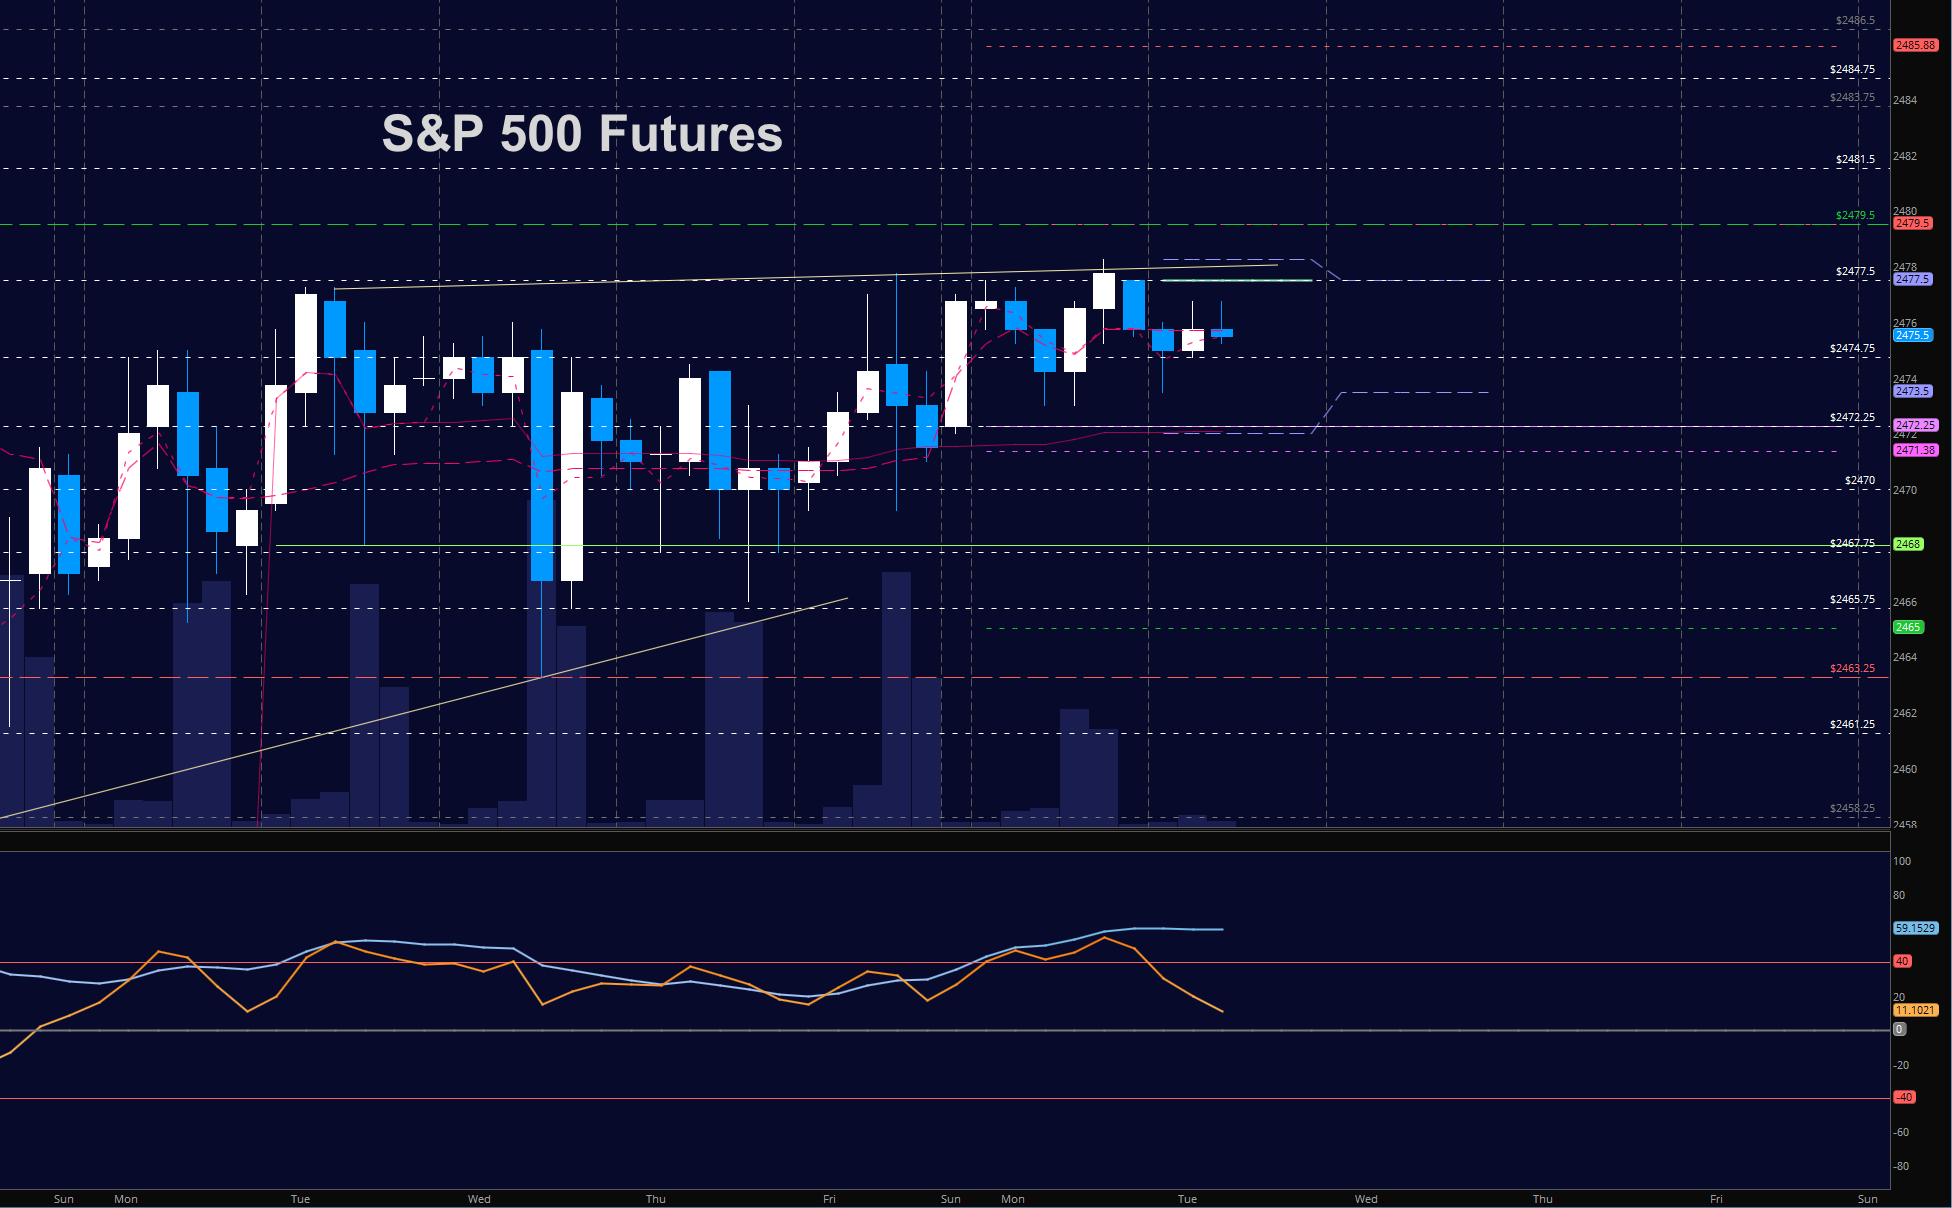
S&P 500 Futures (ES)
Thin volume and higher prices give us the backdrop for today’s trading. Ranges continue to tighten. Support still sits near 2470.5 but 2472 is also a contender for higher support. Resistance is now near 2479.5 as we broke above 2477.5. The bullets below represent the likely shift of trading momentum at the positive or failed retests at the levels noted.
- Buying pressure intraday will likely strengthen above a positive retest of 2477.5 (careful again here with resistance).
- Selling pressure intraday will likely strengthen with a failed retest of 2471.
- Resistance sits near 2477.5 to 2479.5, with 2481.5 and 2483.75 above that.
- Support holds between 2471 and 2469.75, with 2466.5 and 2463.75 below that.
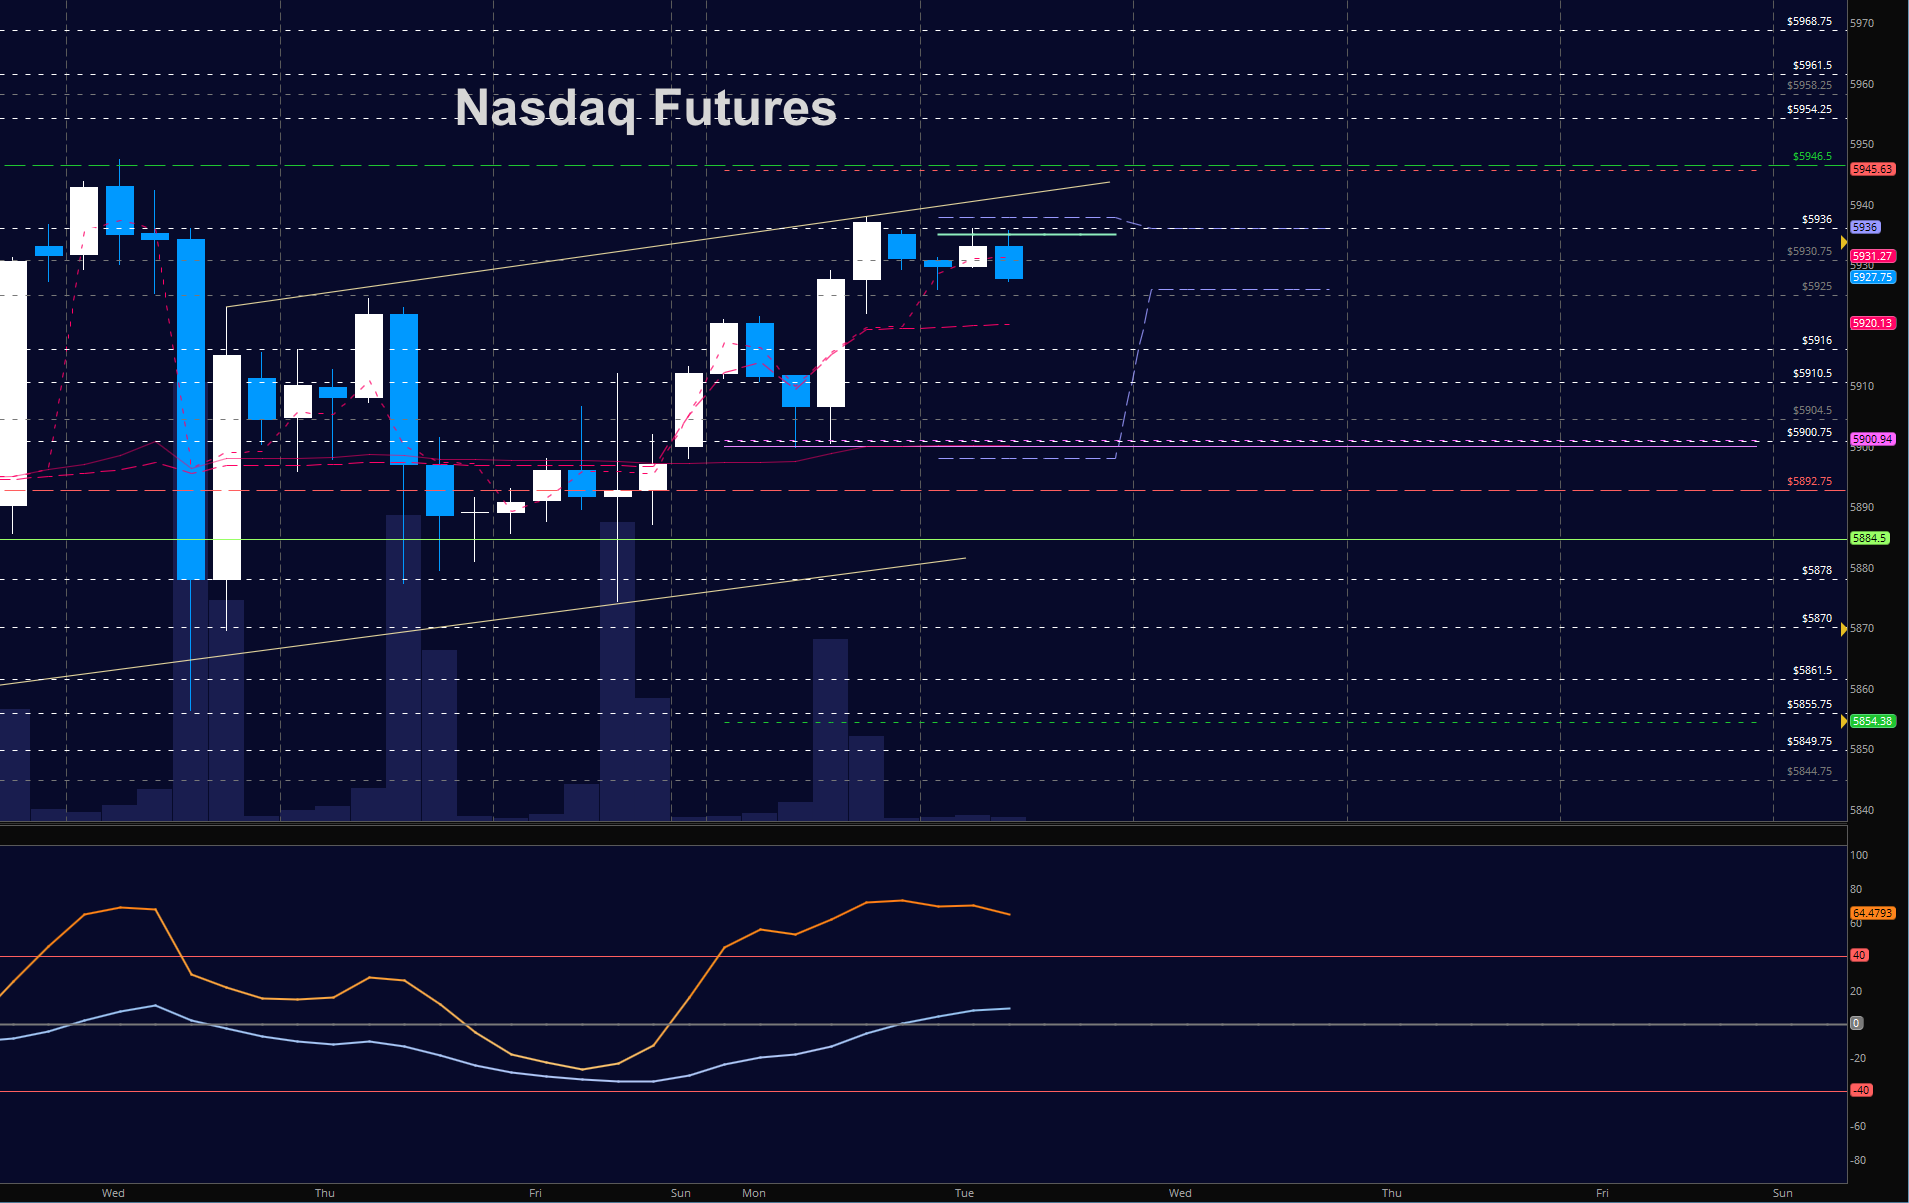
NASDAQ Futures (NQ)
The buyers hold upside pressure here as traders test resistance and fade, likely into higher support. Resistance sits near 5946.5 and then above at 5954.25. Support regions sit near 5920-5877. Momentum remains mixed but now holding higher – also under the very thin volumes noted. The bullets below represent the likely shift of intraday trading momentum at the positive or failed tests at the levels noted.
- Buying pressure intraday will likely strengthen with a positive retest of 5936.
- Selling pressure intraday will likely strengthen with a failed retest of 5920.
- Resistance sits near 5936 to 5946.5, with 5954.5 and 5961.5 above that.
- Support holds between 5921.25 and 5912.5, with 5909.75 and 5901.5 below that.
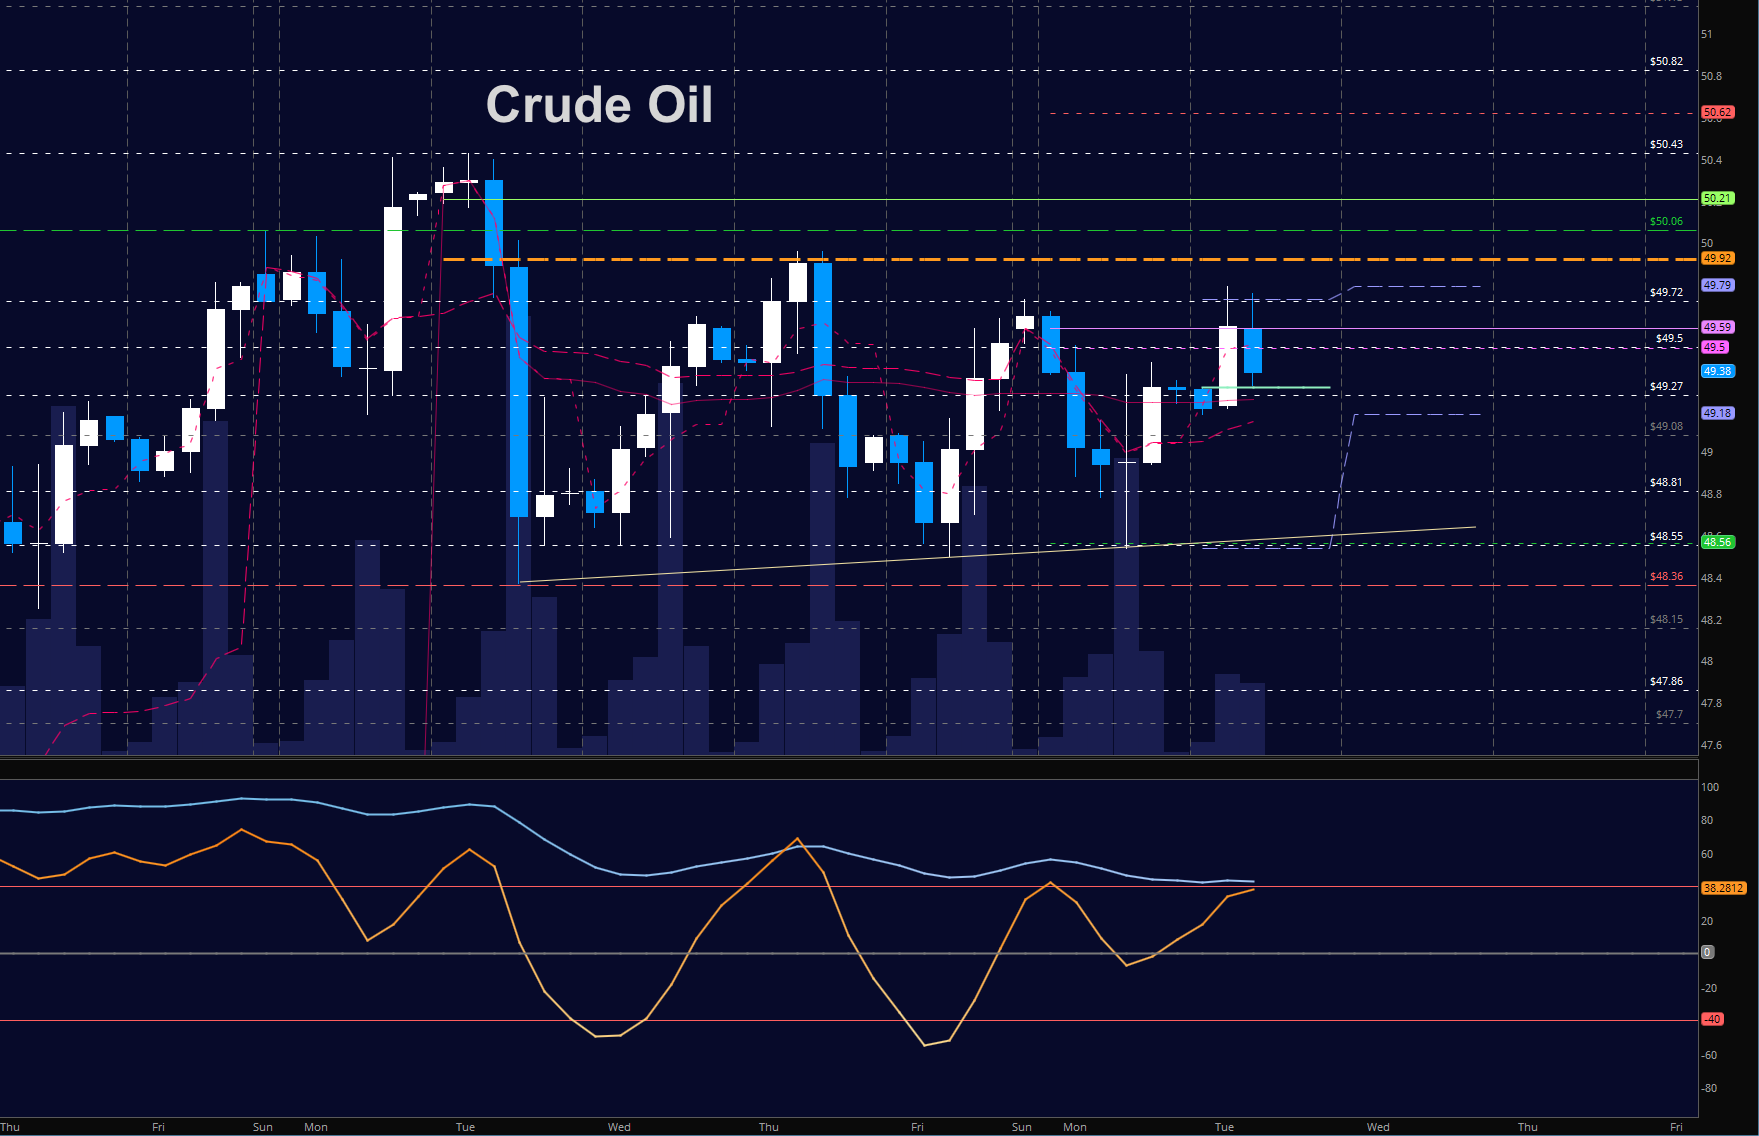
WTI Crude Oil
API report after the close today as hedge funds continue to increase long positions and close out short positions. Higher lows hold this chart in largely bullish formations as traders battle with our 48.80 support levels. Ranges also continue to tighten here. Deep pullbacks will continue to hold regions for buyers to engage in the current formation – and large spikes up will bring sellers out as well. Momentum is mixed to bullish. We held 48.55 as support yesterday. Buyers are in greater control above 49.27. Sellers sit near 49.8 resistance of yesterday. The bullets below represent the likely shift of trading momentum at the positive or failed tests at the levels noted.
- Buying pressure intraday will likely strengthen with a positive retest of 49.83.
- Selling pressure intraday will strengthen with a failed retest of 49.08.
- Resistance sits near 49.79 to 49.95, with 50.12 and 50.41 above that.
- Support holds between 49.18 to 49.08, with 48.78 and 48.55 below that.
If you’re interested in the live trading room, it is now primarily stock market futures content, though we do track heavily traded stocks and their likely daily trajectories as well – we begin at 9am with a morning report and likely chart movements along with trade setups for the day.
As long as the trader keeps himself aware of support and resistance levels, risk can be very adequately managed to play in either direction as bottom picking remains a behavior pattern that is developing with value buyers and speculative traders.
Twitter: @AnneMarieTrades
The author trades stock market futures every day and may have a position in mentioned securities at the time of publication. Any opinions expressed herein are solely those of the author, and do not in any way represent the views or opinions of any other person or entity.

: Cup (and Maybe Handle) Watch")
 Trading Near Top Of Price Range")

