Stock Market Futures Considerations For August 7, 2017
The S&P 500 (INDEXSP:.INX) is pointing marginally higher this morning but overhead price resistance could limit any rallies. See key futures trading levels for S&P 500, Nasdaq, and Crude Oil below.
Check out today’s economic calendar with a full rundown of releases. And note that the charts below are from our premium service and shared exclusively with See It Market readers.
S&P 500 Futures (ES)
Charts tested and rejected prior resistance and traders are headed to higher support tests. Support sits near 2470.5 Resistance is still near 2478 as we remain relatively range bound. The bullets below represent the likely shift of trading momentum at the positive or failed retests at the levels noted.
- Buying pressure intraday will likely strengthen above a positive retest of 2476 (careful again here with resistance).
- Selling pressure intraday will likely strengthen with a failed retest of 2470.
- Resistance sits near 2476 to 2477.5, with 2479.5 and 2483.75 above that.
- Support holds between 2470.5 and 2467.75, with 2465.5 and 2461.75 below that.

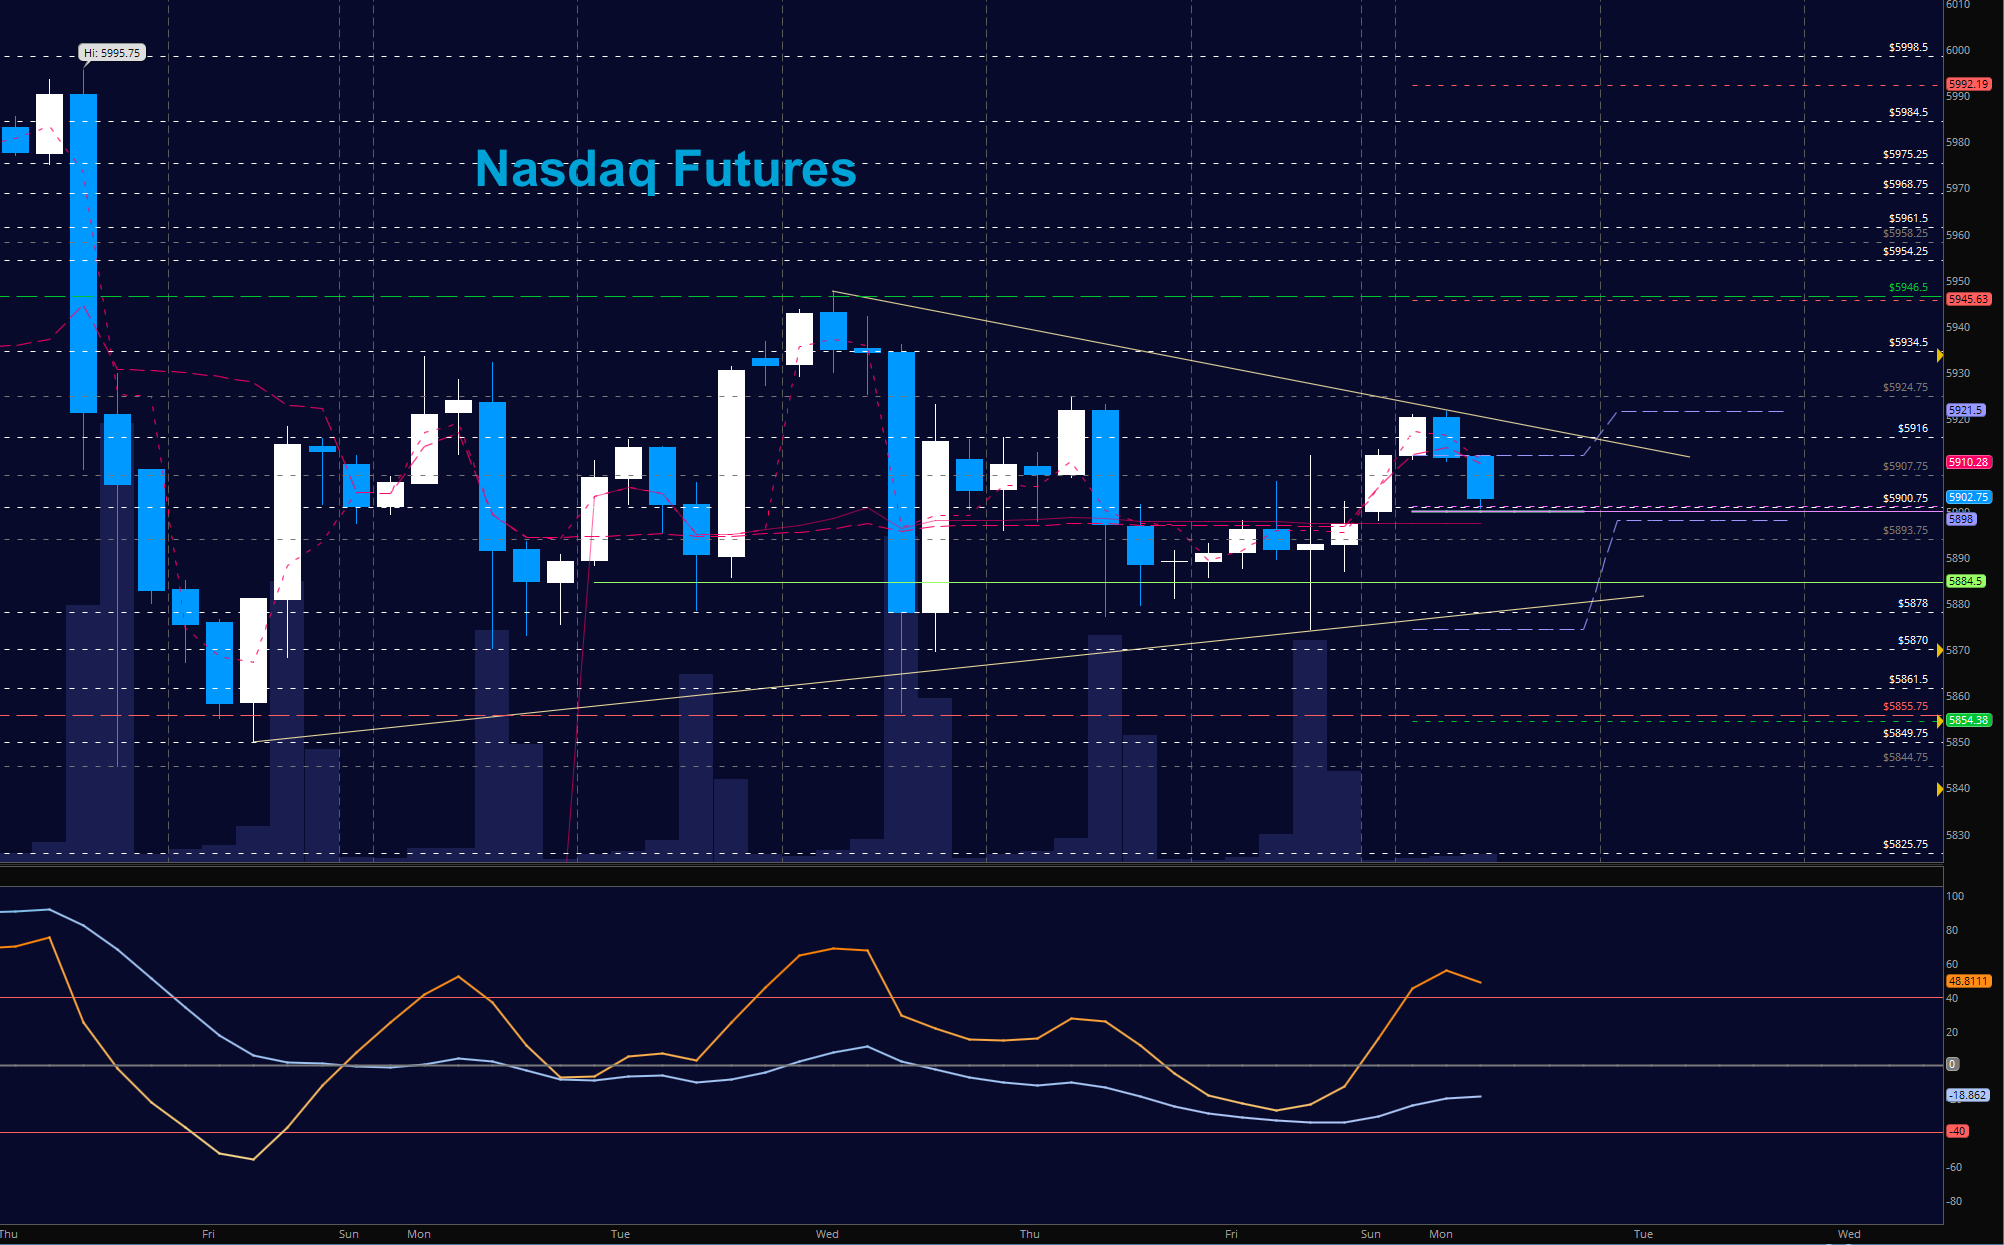
NASDAQ Futures (NQ)
The weak wedge continues to build – with higher lows and lower highs, in general. Resistance sits near 5921.75 and then above at 5934.5. Support regions sit near 5890-5877. Momentum remains mixed but charting a bit lower- suggesting support tests likely off spikes higher. Watch for resolution of price above 5900 to give buyers some advantage. The bullets below represent the likely shift of intraday trading momentum at the positive or failed tests at the levels noted.
- Buying pressure intraday will likely strengthen with a positive retest of 5912.
- Selling pressure intraday will likely strengthen with a failed retest of 5884.
- Resistance sits near 5921 to 5924.75, with 5934.75 and 5946.75 above that.
- Support holds between 5884.5 and 5878, with 5870.75 and 5861.5 below that.
WTI Crude Oil
Range bound behavior at levels between 48.4 and 50.1 or so – but these edges are tightening. Deep pullbacks will continue to hold regions for buyers to engage in the current formation – and large spikes up will bring sellers out as well. Momentum is mixed to bullish. Below 49.1, we are likely to see 48.78, 48.55 and 48.36. Buyers are in greater control above 49.27. The bullets below represent the likely shift of trading momentum at the positive or failed tests at the levels noted.
- Buying pressure intraday will likely strengthen with a positive retest of 49.46.
- Selling pressure intraday will strengthen with a failed retest of 48.30.
- Resistance sits near 49.43 to 49.74, with 49.94 and 50.4 above that.
- Support holds between 48.75 to 48.35, with 48.25 and 47.92 below that.

If you’re interested in watching these trades go live, join us in the live trading room from 9am to 11:30am each trading day. Visit TheTradingBook for more information.
If you’re interested in the live trading room, it is now primarily stock market futures content, though we do track heavily traded stocks and their likely daily trajectories as well – we begin at 9am with a morning report and likely chart movements along with trade setups for the day.
As long as the trader keeps himself aware of support and resistance levels, risk can be very adequately managed to play in either direction as bottom picking remains a behavior pattern that is developing with value buyers and speculative traders.
Twitter: @AnneMarieTrades
The author trades stock market futures every day and may have a position in mentioned securities at the time of publication. Any opinions expressed herein are solely those of the author, and do not in any way represent the views or opinions of any other person or entity.


