This week was phenomenal for risk assets! The S&P 500 and the Nasdaq 100 both reached all-time highs, and the Dow Jones even briefly peaked above 40,000 for the first time in market history.
It’s been an exciting ride, but the big question on everyone’s mind is: is this remarkable surge sustainable?
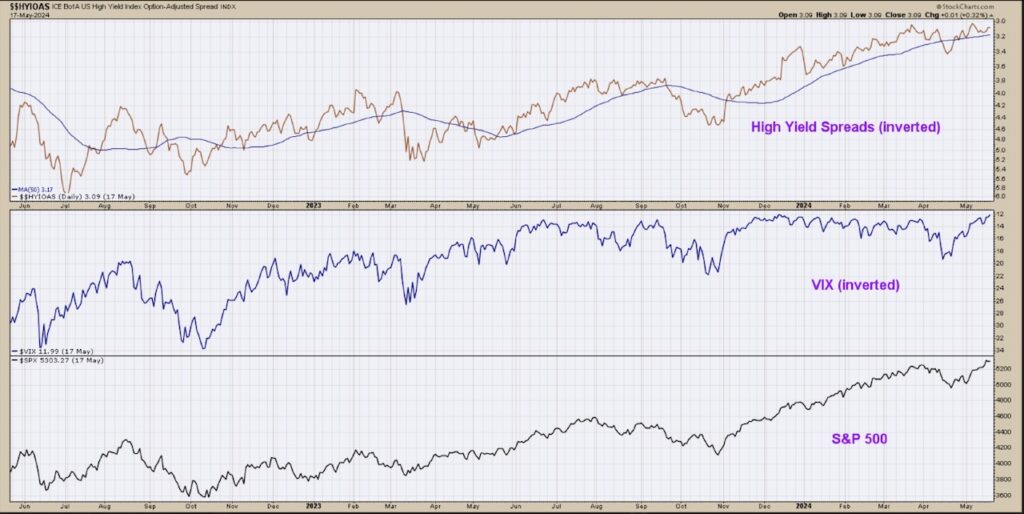
In this week’s video, we’ll use two different macro indicators to determine trend strength in the current bull market phase. We’ll also describe how high yield spreads can gauge investors’ risk appetite and how volatility tells us a great deal about investor anxiety.
By combining these macro drivers with traditional trend-following tools, you’ll get a well-rounded perspective on what’s driving these market moves. (for quick reference, see chart below)
- How can integrating both technical and macro factors improve an investor’s decision-making process and identify stocks with strong potential for growth?
- What changes in bond market spreads and volatility should investors observe as potential warning indicators for increasing risk or changes in market dynamics?
- Why is it crucial to adopt a trend-following strategy and emphasize maintaining investments in assets that continue to show strength, instead of selling based on arbitrary price targets?
Video: S&P 500 All-Time Highs – One Chart To Watch!
Chart
Twitter: @DKellerCMT
The author may have positions in mentioned securities at the time of publication. Any opinions expressed herein are solely those of the author, and do not in any way represent the views or opinions of any other person or entity.


