Stock Market Futures Considerations For August 10, 2017
The S&P 500 (INDEXSP:.INX) has been volatile and choppy. A nice bounce (yesterday) is giving way to more weakness today. Traders should eye potential price support and resistance for long/short trade entries. See below.
Check out today’s economic calendar with a full rundown of releases. And note that the charts below are from our premium service and shared exclusively with See It Market readers.
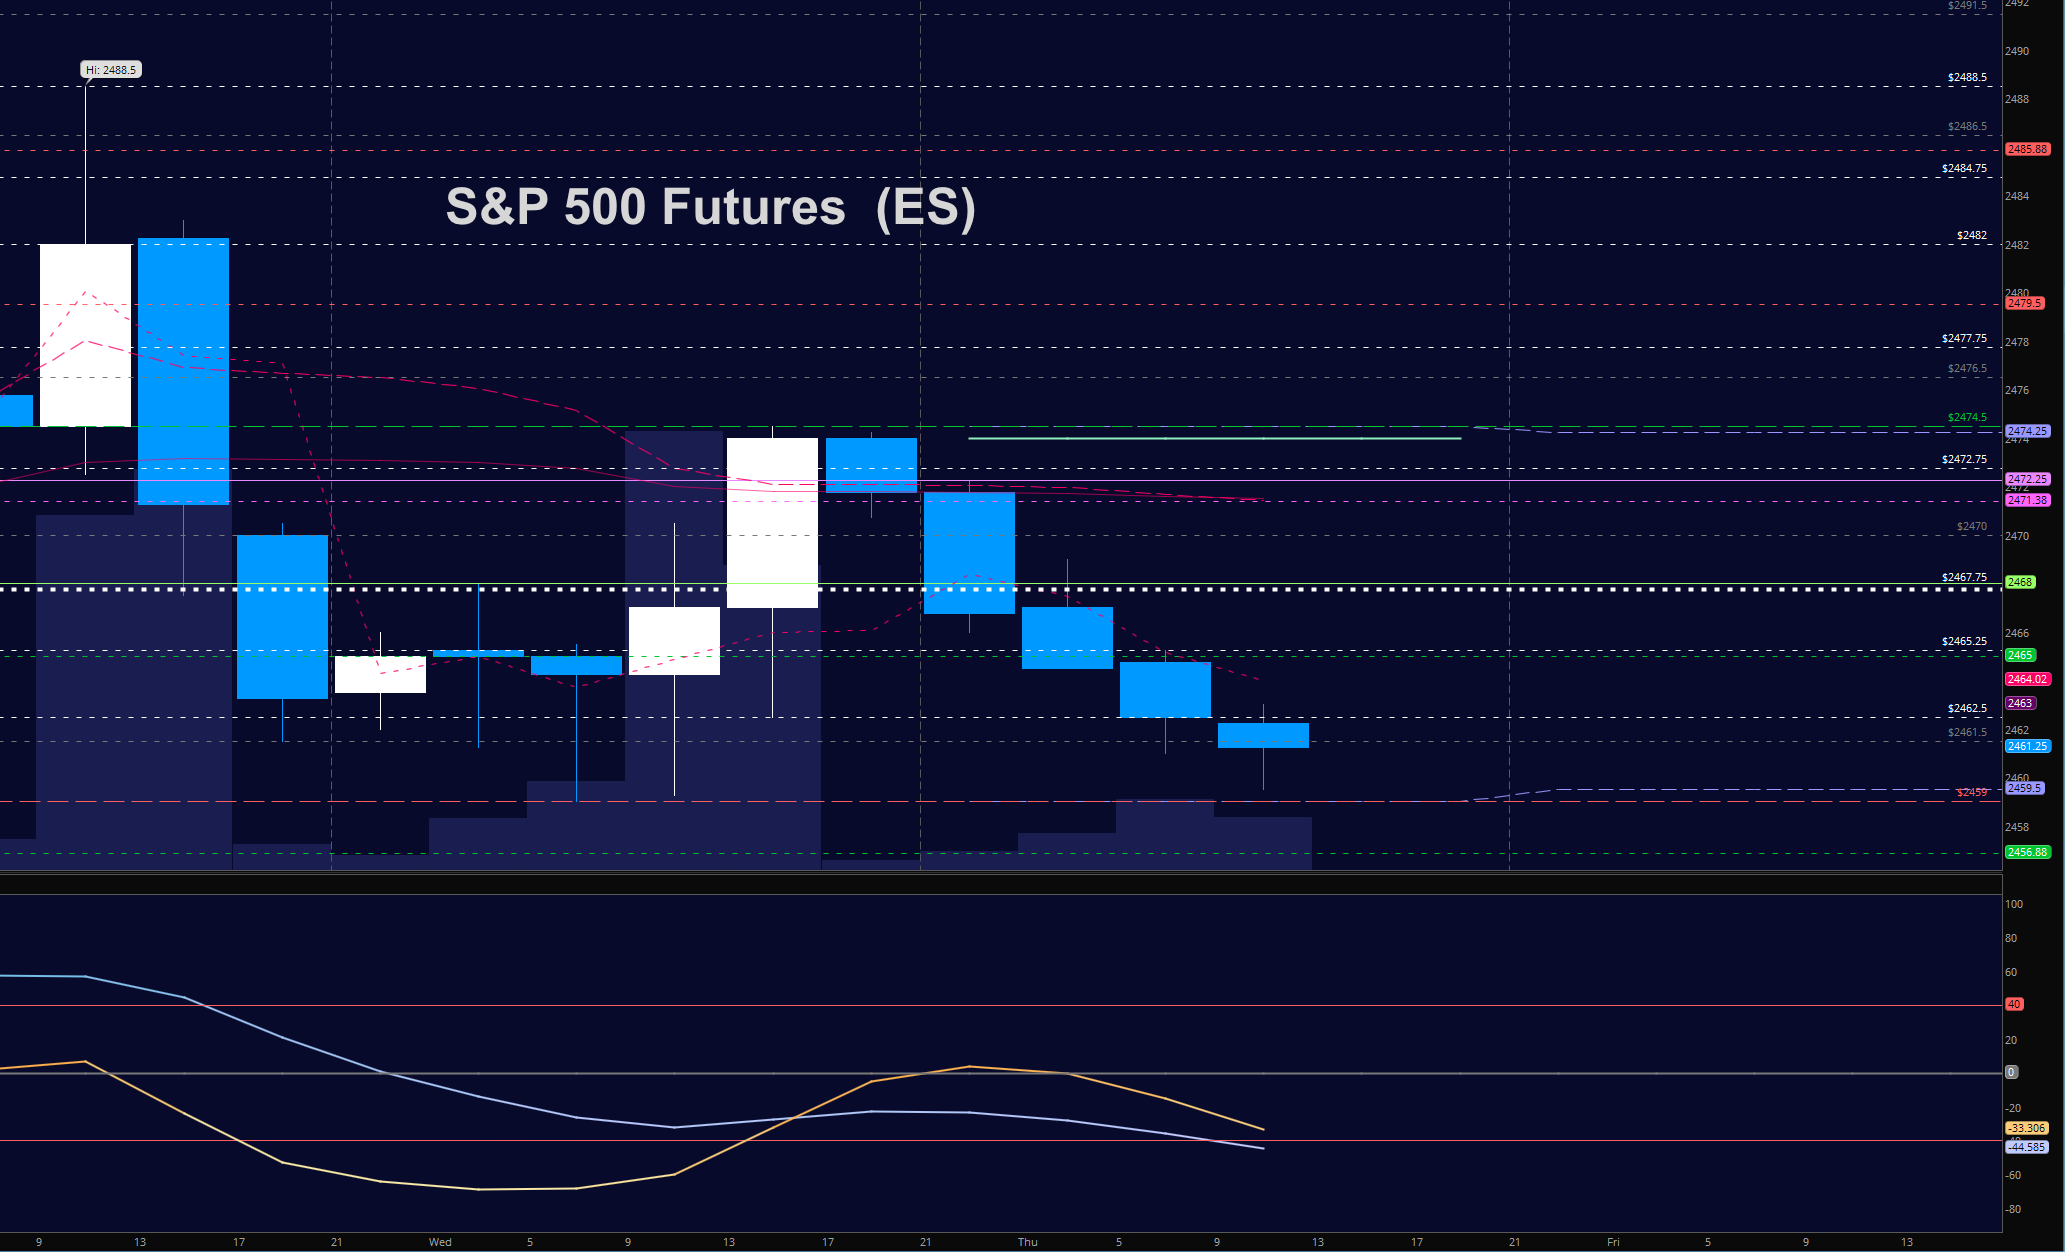
S&P 500 Futures (ES)
Support tests here and a bit of negative momentum suggests these charts will bounce into lower highs as they attempt to hold the baseline support regions near 2461. A failed retest here will be definitely bearish for motion. The bullets below represent the likely shift of trading momentum at the positive or failed retests at the levels noted.
- Buying pressure intradaywill likely strengthen above a positive retest of 2468 (careful again here with resistance as momentum is bearish)
- Sellingpressure intraday will likely strengthen with a failed retest of 2457
- Resistance sits near 2470.5 to 2472.5, with 2475.75 and 2478 above that
- Support holds between 2459 and 2457, with 2451.5 and 2449.75 below that
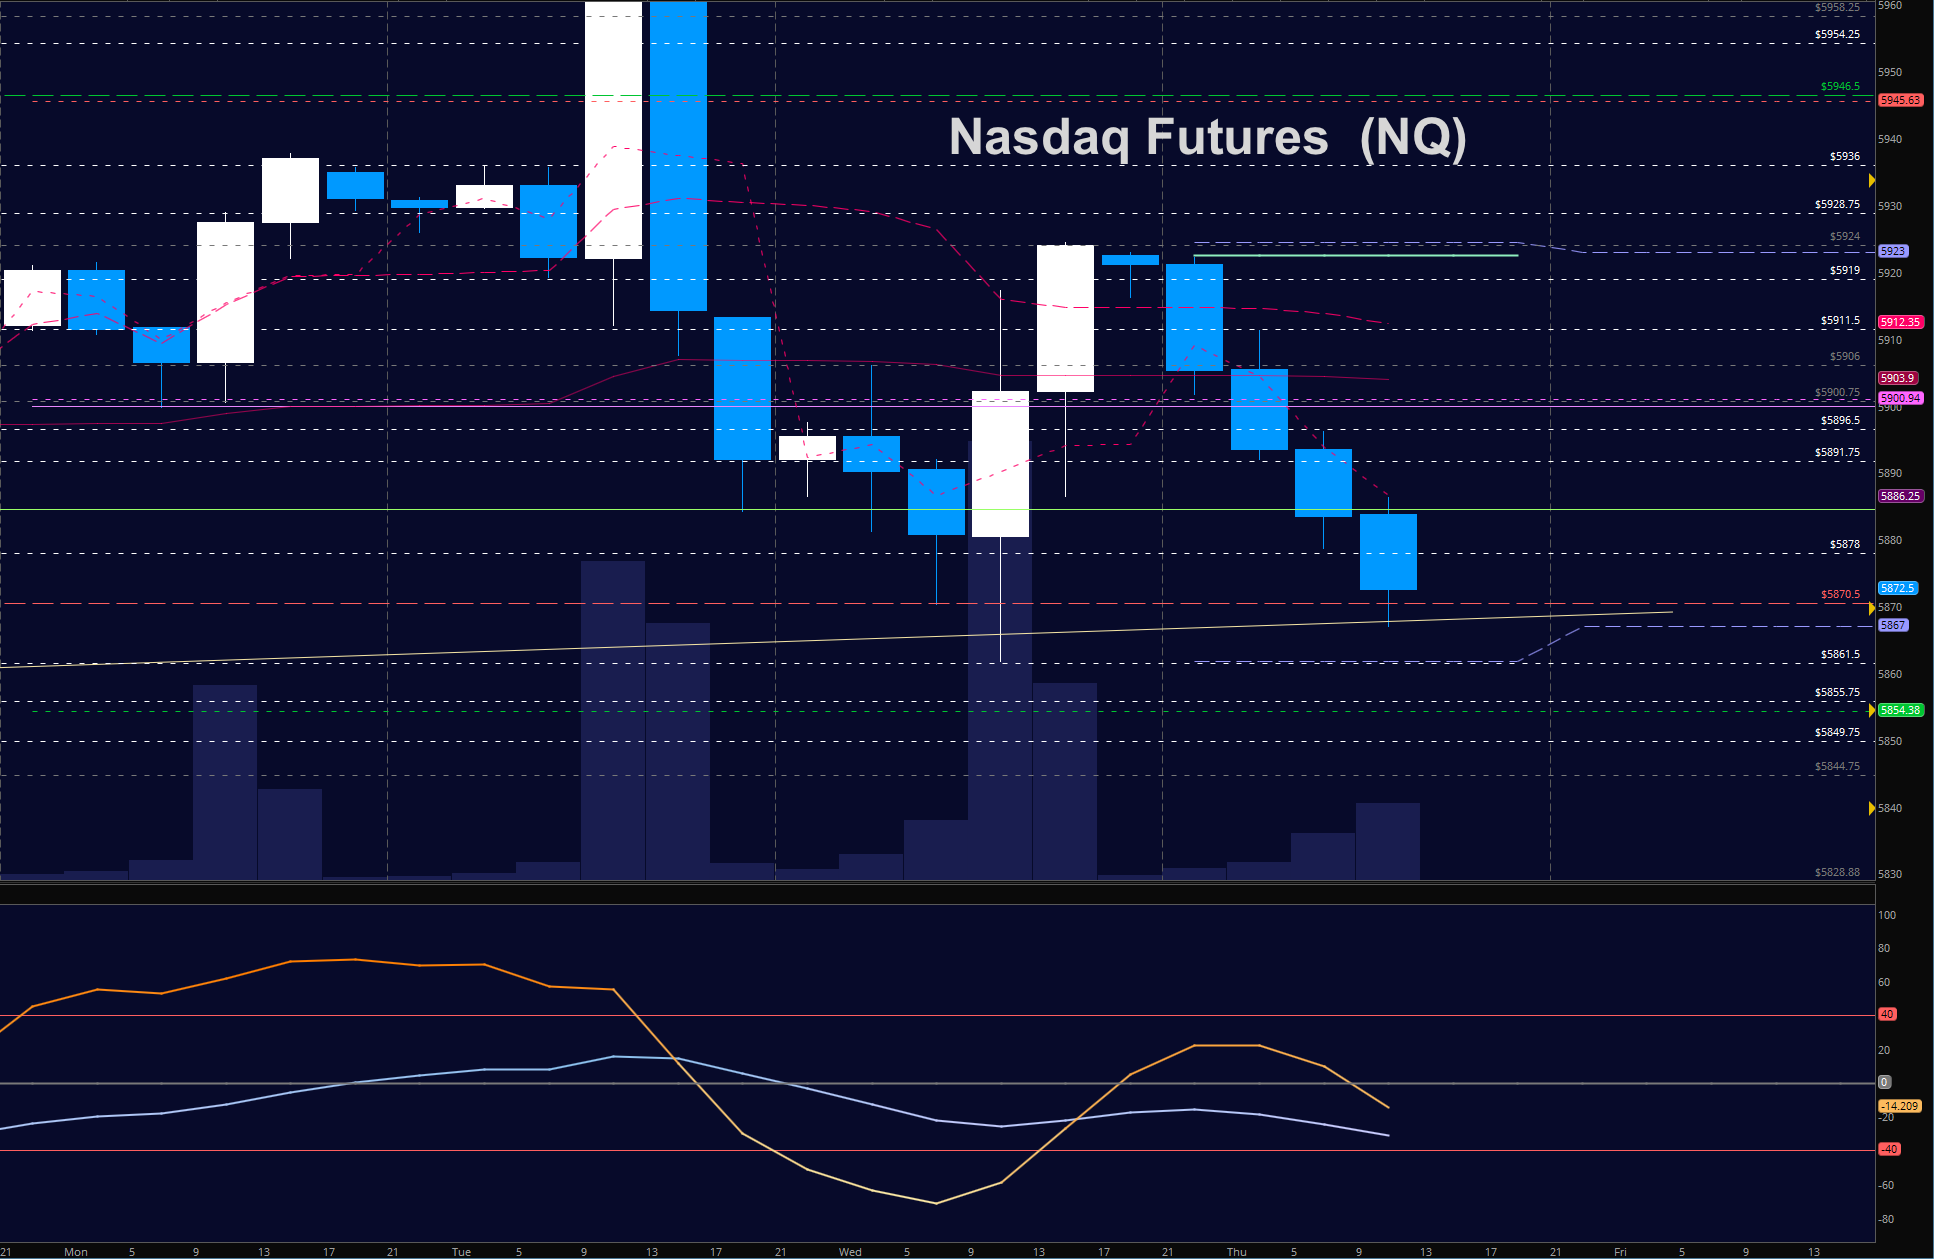
NASDAQ Futures (NQ)
Buyers are struggling with support zones near 5880 under a negative momentum environment. Momentum is still negative. The bullets below represent the likely shift of intraday trading momentum at the positive or failed tests at the levels noted.
- Buyingpressure intraday will likely strengthen with a positive retest of 5907
- Sellingpressure intraday will likely strengthen with a failed retest of 5878
- Resistance sits near 5896.75 to 5906.5, with 5913.5 and 5929.5 above that
- Support holds between 5880.25 and 5871.5, with 5861.5 and 5854.5 below that
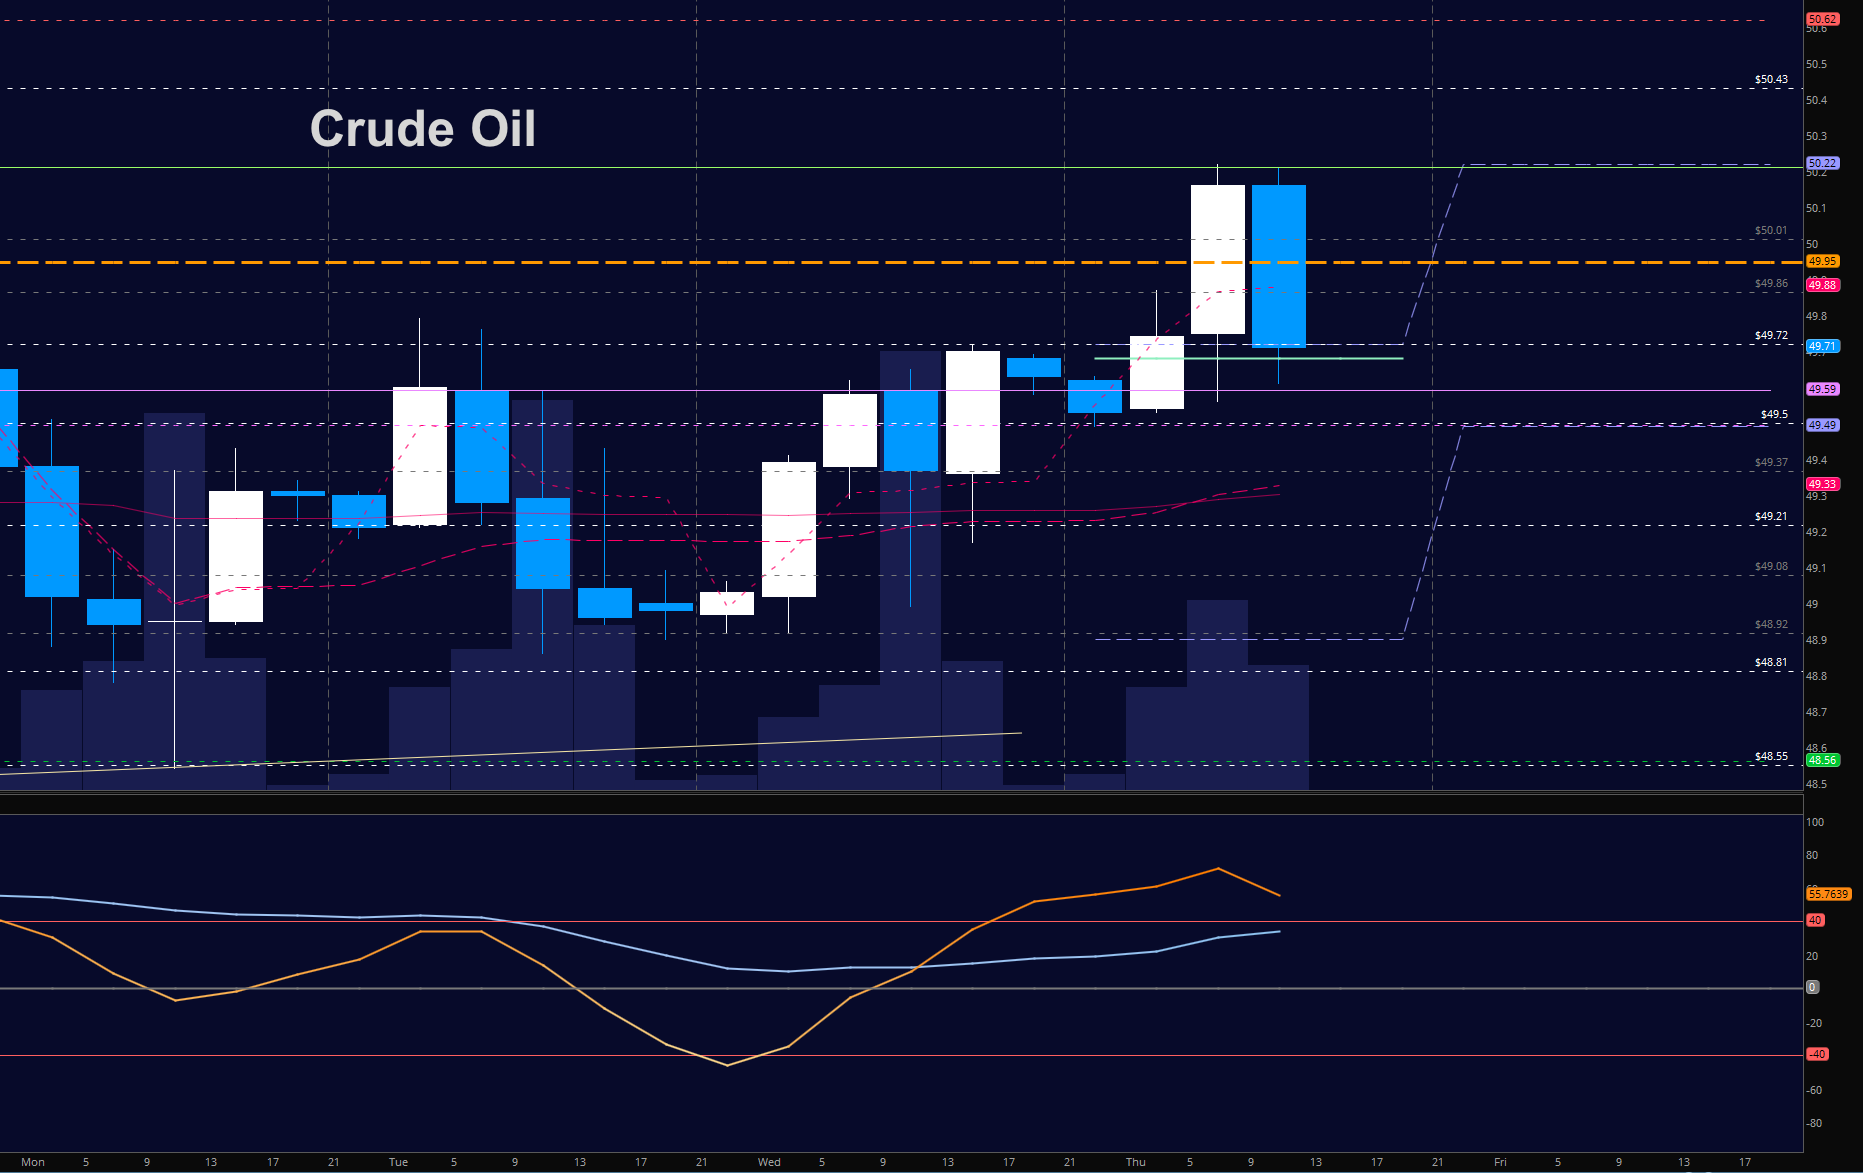
WTI Crude Oil
Momentum is mixed to bullish as traders take profit into higher lows. Buyers remain in greater control. Sellers sit near 50.24. The bullets below represent the likely shift of trading momentum at the positive or failed tests at the levels noted.
- Buyingpressure intraday will likely strengthen with a positive retest of 50.24
- Sellingpressure intraday will strengthen with a failed retest of 49.45
- Resistance sits near 50.12 to 50.24, with 50.42 and 50.84 above that
- Support holds between 49.6 to 49.45, with 49.1 and 48.55 below that
If you’re interested in the live trading room, it is now primarily stock market futures content, though we do track heavily traded stocks and their likely daily trajectories as well – we begin at 9am with a morning report and likely chart movements along with trade setups for the day.
As long as the trader keeps himself aware of support and resistance levels, risk can be very adequately managed to play in either direction as bottom picking remains a behavior pattern that is developing with value buyers and speculative traders.
Twitter: @AnneMarieTrades
The author trades stock market futures every day and may have a position in mentioned securities at the time of publication. Any opinions expressed herein are solely those of the author, and do not in any way represent the views or opinions of any other person or entity.
: Creating Bullish Divergence?")


: Creating Bullish Divergence?")