Stock Market Considerations For February 16, 2017
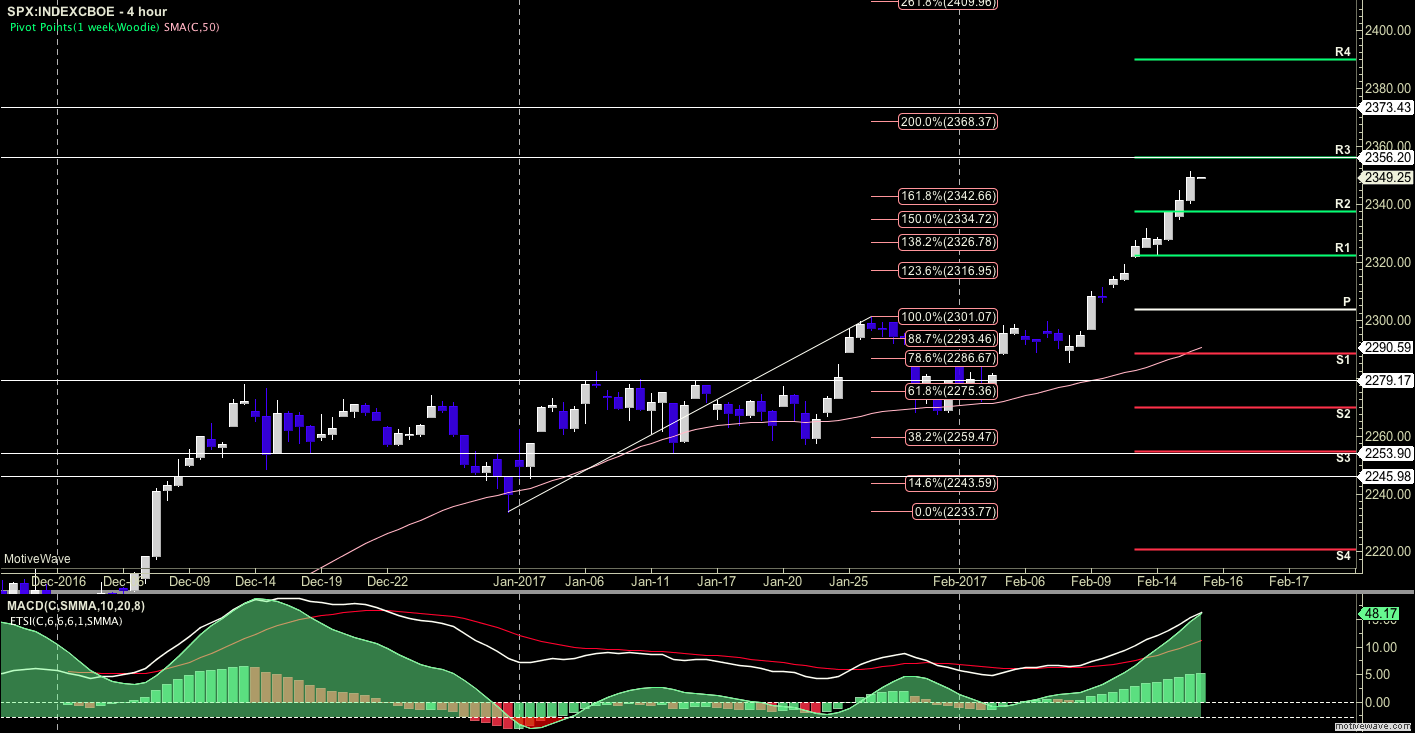
A new high formed yesterday afternoon on the S&P 500 (INDEXSP:.INX) and it was not breached overnight. Bullish action still holds but drifts into higher support should be ‘business as usual’ in this chart. We remain resoundingly bullish, but monitoring position size here is key. Market pullbacks will still be bought – the chart is not exhibiting anything that suggests collapse. Trending formations hold steady – this means reversal trades become quite dangerous.
Buying pressure on S&P 500 futures will likely strengthen above a positive retest of 2350.5, while selling pressure will strengthen with a failed retest of 2334.
Price resistance on S&P 500 futures sits near 2350 to 2352.5, with 2356.75 and 2358.25 above that. Price support holds between 2329 and 2323.5, with 2319.5 and 2313.25 below that
See today’s economic calendar with a rundown of releases.
TODAY’S RANGE OF MOTION
E-mini S&P 500 Futures – February 16
Upside trades – Two options for entry
- Positive retest of continuation level -2352
- Positive retest of support level– 2343
- Opening targets ranges – 2346.75, 2351.25, 2354.5, 2356, 2358.75, 2363.50, and 2367
Downside trades – Two options for entry
- Failed retest of resistance level -2346 (careful here – very countertrend though toppy)
- Failed retest of support level– 2338.5
- Opening target ranges – 2343.25, 2338.5, 2334, 2329.25, 2323.5, 2319, 2315.25, 2313, 2309.75, 2304.75, 2302.75, 2299.5, 2297, 2294.25, 2291.75, 2288.5, 2284.5, 2279.75, 2276.25, 2274.25, 2272.25, 2269.5, 2264.5, 2260.5, 2256, 2253.5 and 2249.75
Nasdaq Futures
The NQ_F also presented with a new high yesterday and holds in a bullish trend ( though sideways for the last 16 hours or so. A fade to support is quite likely here (but I said that yesterday and the fade was only 16 points wide). As a measure of reference, the Nasdaq is up 4% for the month – extraordinary motion that is likely to retrace. So far, the trend holds steady so pullbacks will still hold, at least into lower highs if the chart loses power and begins to roll over.
- Buying pressure will likely strengthen with a positive retest of 5315.75
- Selling pressure will strengthen with a failed retest of 5284.25
- Resistance sits near 5315.25 to 5325, with 5340.75 and 5354.75 above that
- Support holds between 5297.5 and 5286.5, with 5276.75 and 5269.5 below that
Upside trades – Two options
- Positive retest of continuation level -5313.5
- Positive retest of support level– 5297.75
- Opening target ranges – 5293, 5297.75, 5306.5, 5313, 5315.75, 5325.5, 5340.75, 5354.5, and 5369.25
Downside trades- Two options
- Failed retest of resistance level -5297.25
- Failed retest of support level– 5293.25
- Opening target ranges –5293, 5286.5, 5277.75, 5273.75, 5271.25, 5267.25, 5263.25, 5259, 5252.75, 5246.75, 5240.25, 5235.25, 5229.75, 5227.75, 5221.75, 5217.75, 5212.5, 5207.5, 5202.25, 5197, 5186.25, 5180, 5173.75, 5167.25, 5161.5, 5157.25, 5154.5, 5151.5, 5145.5, and 5140.5
Crude Oil –WTI
Oil held steady in the congestion region after the EIA report as we remain in congested wait states. Interesting undercurrents here – with divergent themes of information. I expected a failed test of resistance and a fade, but instead we have held the support area. The range between 51.5 and 54.3 remains uncontested.
- Buying pressure will likely strengthen with a positive retest of 54.05
- Selling pressure will strengthen with a failed retest of 52.7
- Resistance sits near 53.54 to 53.68, with 53.88 and 54.05 above that.
- Support holds between 52.63 and 52.37, with 52.2 and 51.78 below that.
Upside trades – Two options
- Positive retest of continuation level -53.54
- Positive retest of support level– 53.22
- Opening target ranges – 53.35, 53.68, 53.9, 54.05, 54.19, 54.34, 54.51, 54.76, 55.02, 55.19, and 55.35
Downside trades- Two options
- Failed retest of resistance level -53.3
- Failed retest of support level– 53.01
- Opening target ranges– 52.85, 53.06, 52.86, 52.64, 52.37, 52.2, 52.06, 51.91, 51.72, 51.52, 51.22, 51.04, 50.82, 50.47, 50.3, and 50.16
If you’re interested in the live trading room, it is now primarily stock market futures content, though we do track heavily traded stocks and their likely daily trajectories as well – we begin at 9am with a morning report and likely chart movements along with trade setups for the day.
As long as the trader keeps himself aware of support and resistance levels, risk can be very adequately managed to play in either direction as bottom picking remains a behavior pattern that is developing with value buyers and speculative traders.
Twitter: @AnneMarieTrades
The author trades stock market futures every day and may have a position in mentioned securities at the time of publication. Any opinions expressed herein are solely those of the author, and do not in any way represent the views or opinions of any other person or entity.


: Showing Some Signs of Emerging Strength")
