Stock Market Future Considerations For August 16, 2017
The S&P 500 (INDEXSP:.INX) is trading in a 10 point range but traders should be on alert for a break of support/resistance and continuation. Key levels on the S&P 500, Nasdaq, and crude oil are below.
Check out today’s economic calendar with a full rundown of releases. And note that the charts below are from our premium service and shared exclusively with See It Market readers.
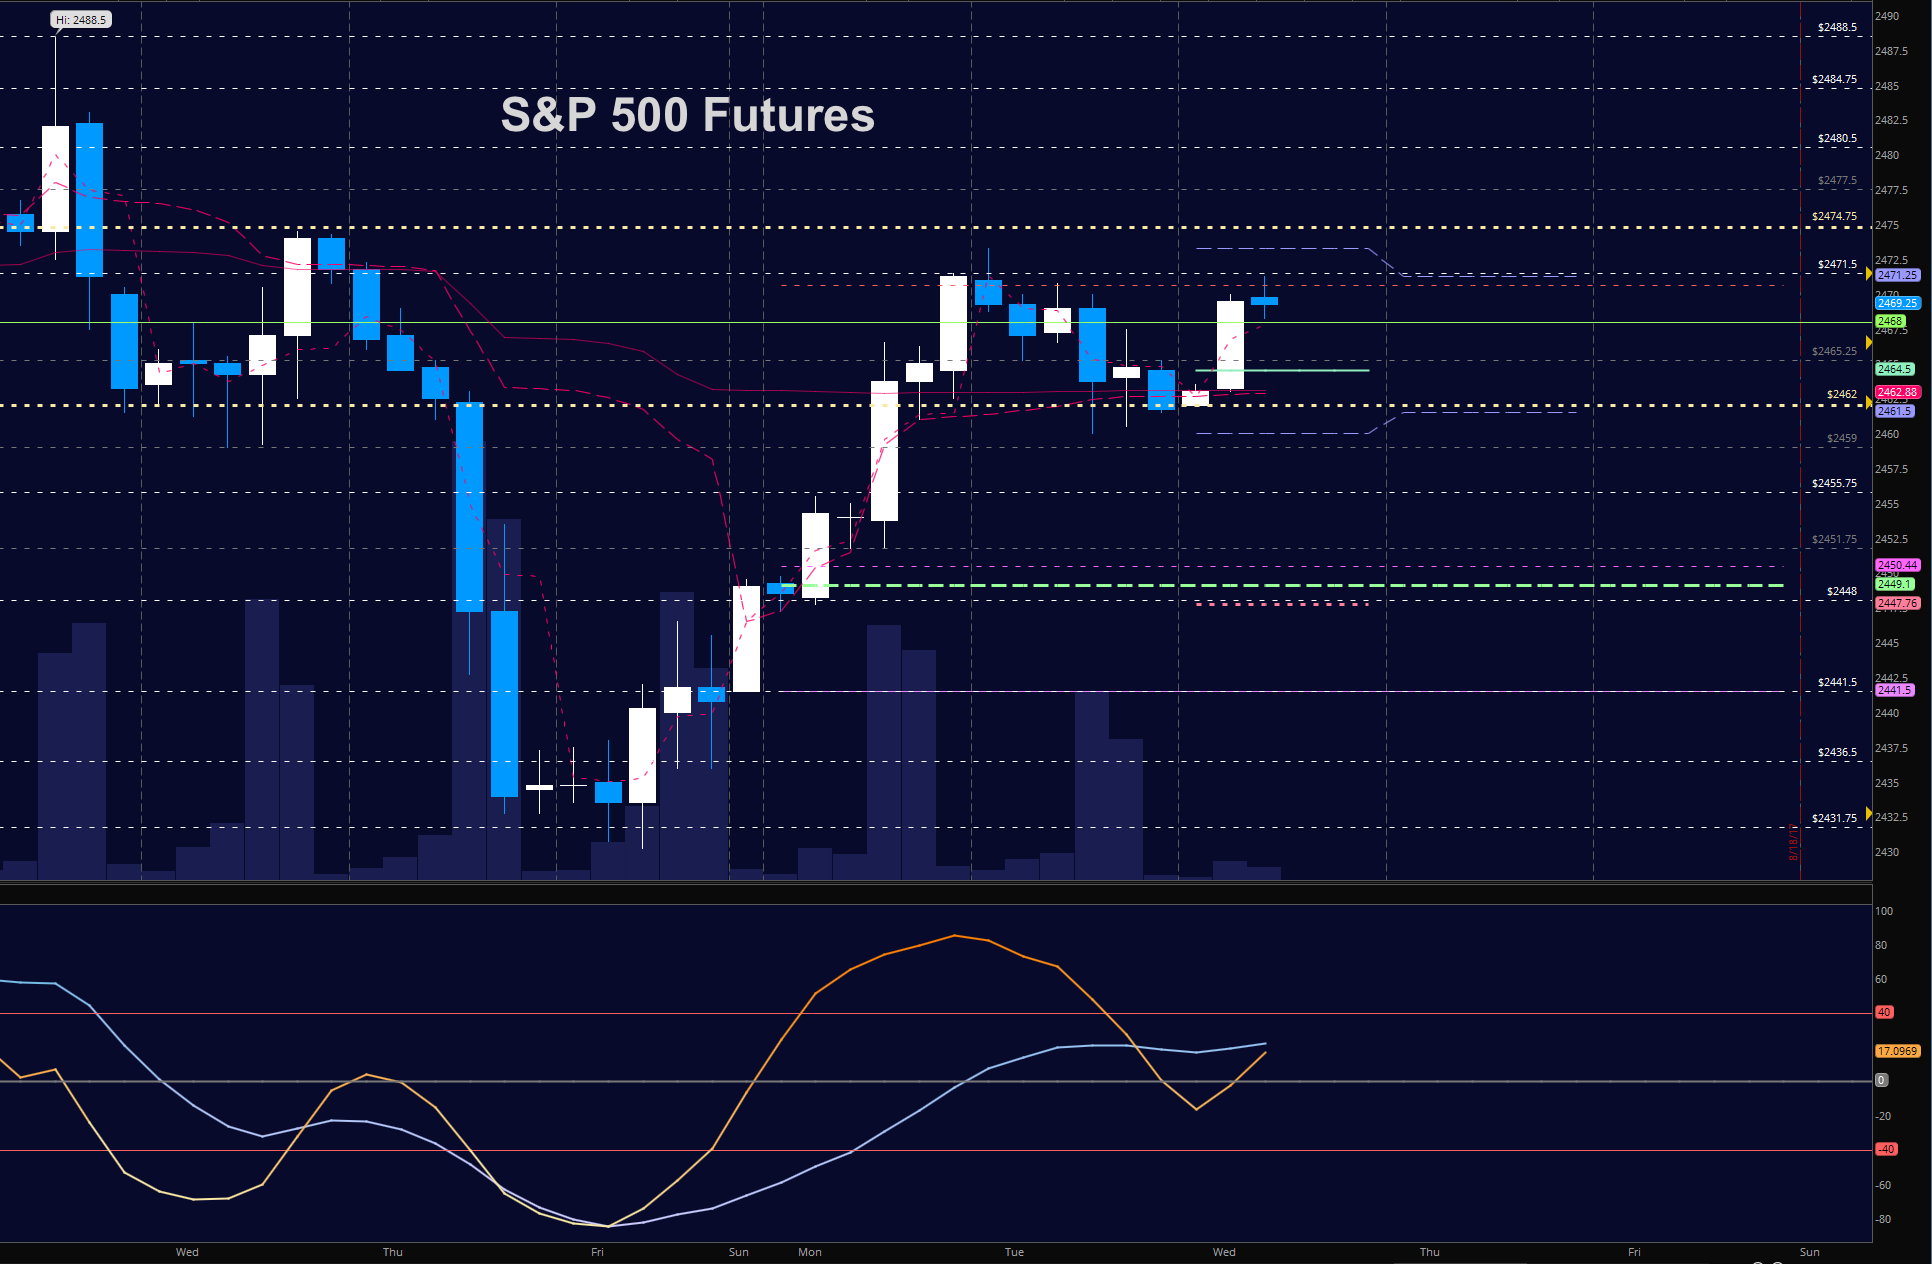
S&P 500 Futures
Volume remains low as charts move back into primary congestion zones seen this summer. Bounces off support should hold at congestion, and rejections off resistance should fade back into the midline of motion near 2468. However, breaches of these levels of support and/or resistance could easily trigger continuation. The bullets below represent the likely shift of trading momentum at the positive or failed retests at the levels noted.
- Buying pressure intradaywill likely strengthen above a positive retest of 2474
- Sellingpressure intraday will likely strengthen with a failed retest of 2459.25
- Resistance sits near 2471.5 to 2474, with 2478 and 2482.5 above that.
- Support holds between 2461.5 and 2455.75, with 2451.5 and 2445.5 below that.
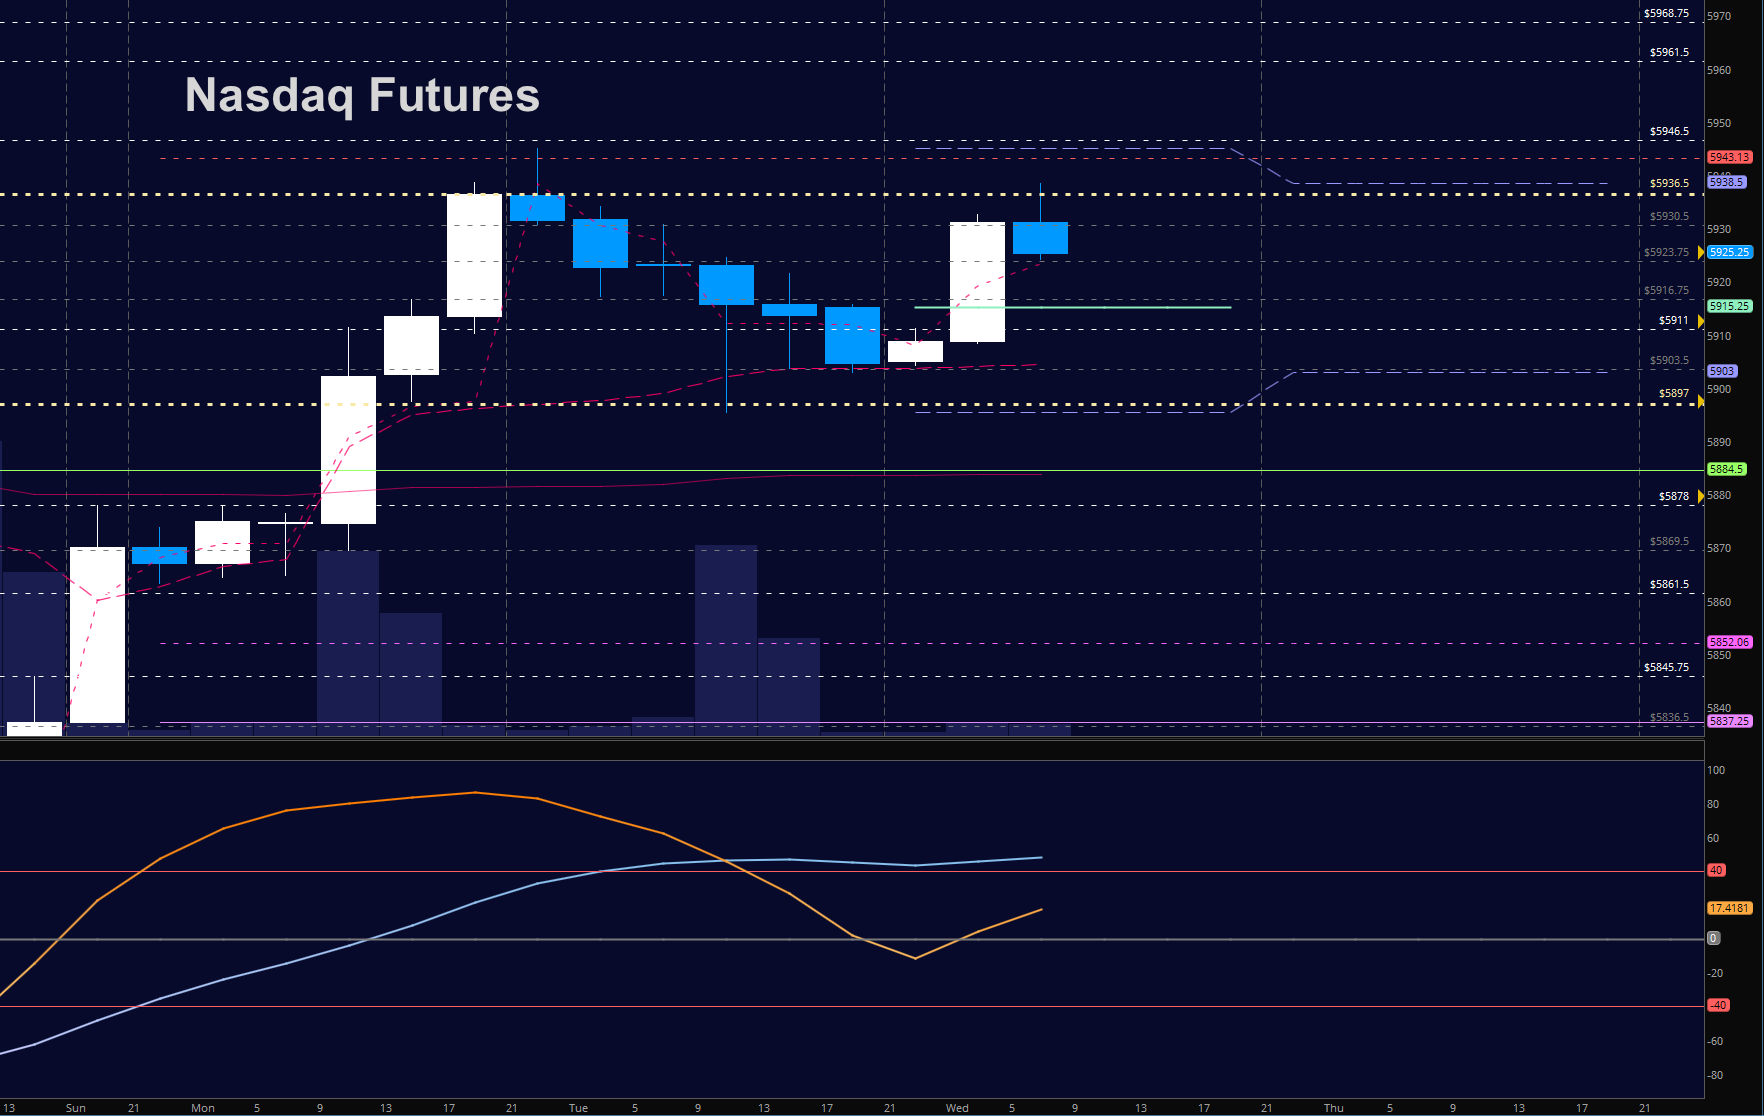
NASDAQ Futures
Bounces hold – but resistance near 5938. Pullbacks are likely to find buyers in the current cycles. Momentum is mixed. The bullets below represent the likely shift of intraday trading momentum at the positive or failed tests at the levels noted.
- Buyingpressure intraday will likely strengthen with a positive retest of 5938
- Sellingpressure intraday will likely strengthen with a failed retest of 5896
- Resistance sits near 5930.5 to 5936.75, with 5946.5 and 5961.5 above that.
- Support holds between 5910.25 and 5903.5, with 5897.75 and 5884.75 below that.
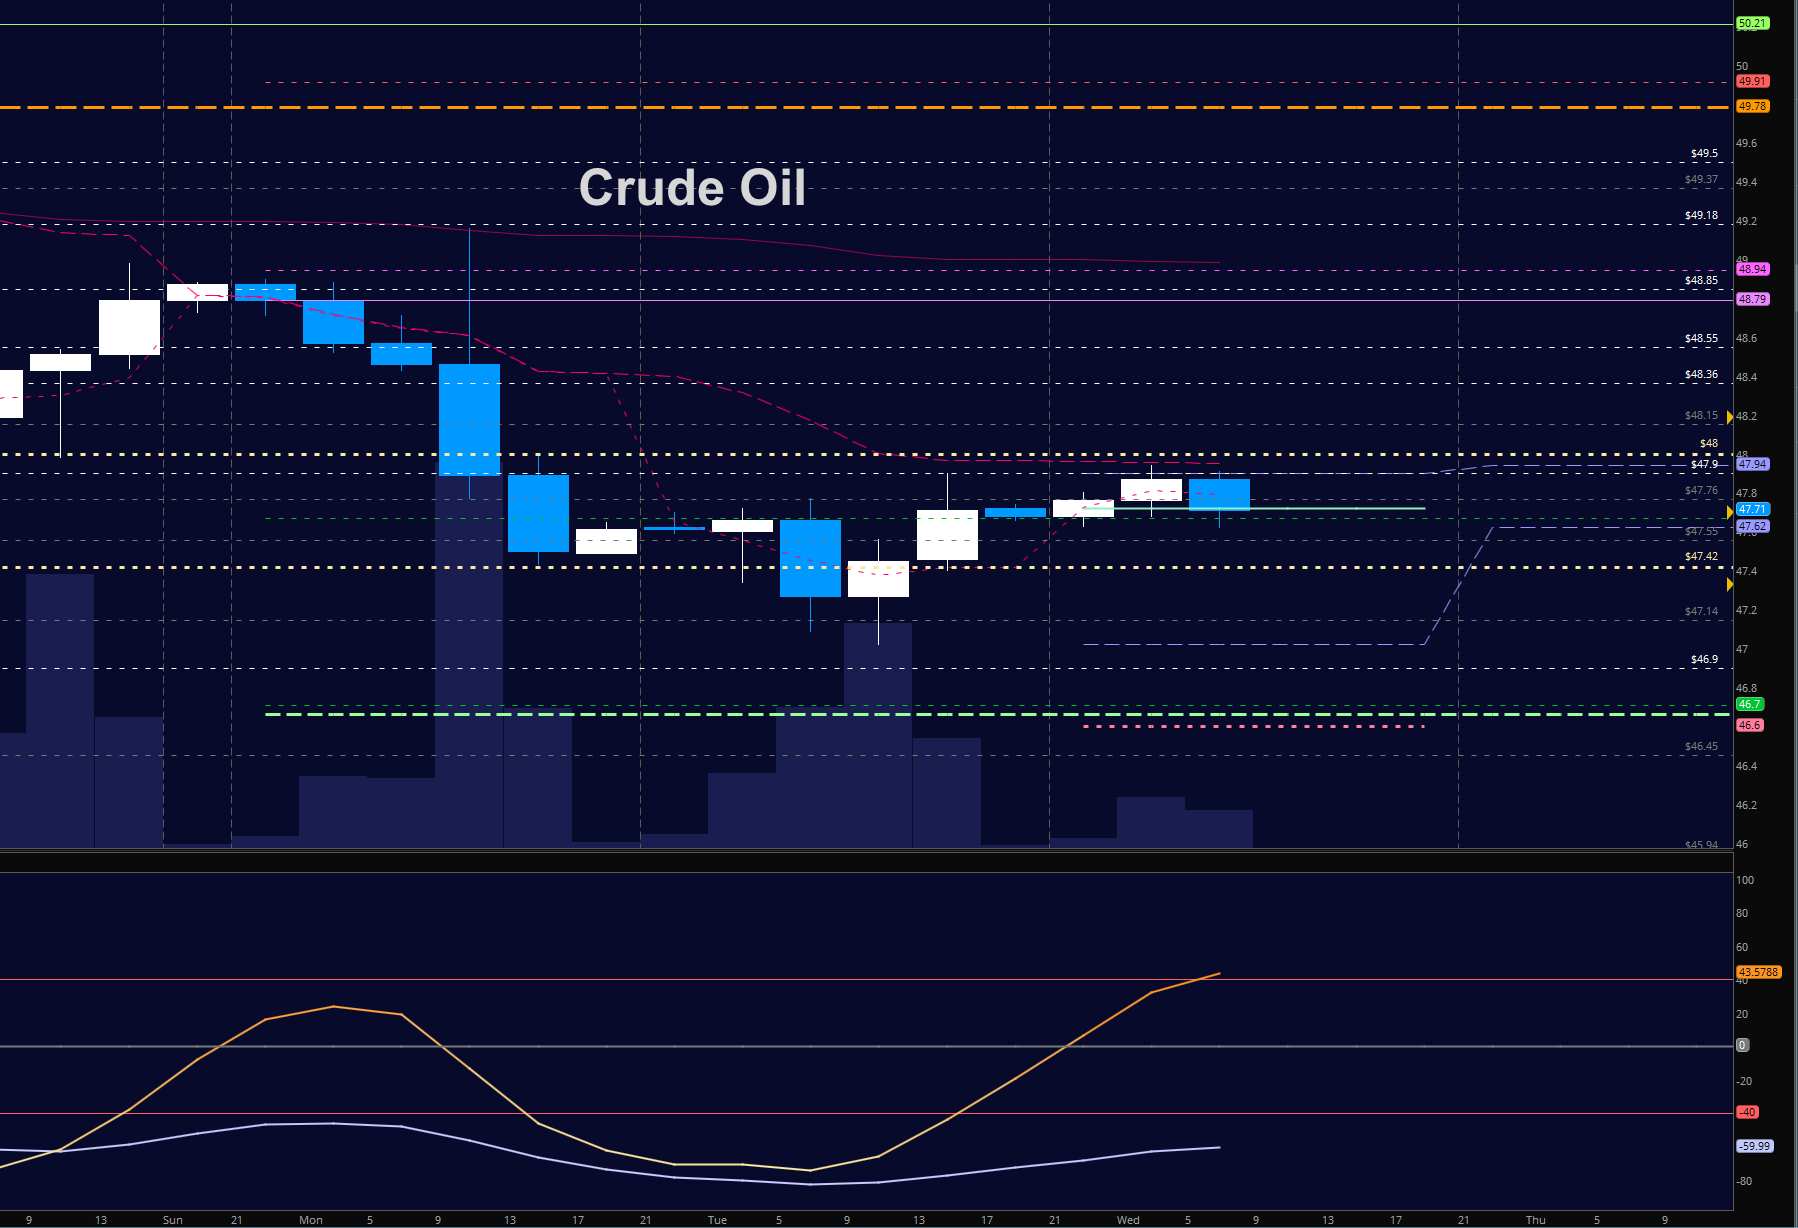
WTI Crude Oil
Support is holding as traders wait for the EIA report out this morning. Bounces into resistance will meet sellers. Resistance extends all the way into 48.9. Momentum is mixed. The bullets below represent the likely shift of trading momentum at the positive or failed tests at the levels noted.
- Buyingpressure intraday will likely strengthen with a positive retest of 48.04
- Sellingpressure intraday will strengthen with a failed retest of 47.01
- Resistance sits near 47.94 to 48.49, with 48.82 and 49.14 above that.
- Support holds between 47.44 to 47.14, with 46.9 and 46.6 below that.
If you’re interested in the live trading room, it is now primarily stock market futures content, though we do track heavily traded stocks and their likely daily trajectories as well – we begin at 9am with a morning report and likely chart movements along with trade setups for the day.
As long as the trader keeps himself aware of support and resistance levels, risk can be very adequately managed to play in either direction as bottom picking remains a behavior pattern that is developing with value buyers and speculative traders.
Twitter: @AnneMarieTrades
The author trades stock market futures every day and may have a position in mentioned securities at the time of publication. Any opinions expressed herein are solely those of the author, and do not in any way represent the views or opinions of any other person or entity.

: Creating Bullish Divergence?")

: Creating Bullish Divergence?")


