Stock Market Futures Considerations For August 14, 2017
The S&P 500 (INDEXSP:.INX) is rallying on Monday morning. But the bounce is likely to find resistance shortly. Below are futures trading levels for the S&P 500, Nasdaq, and Crude Oil.
Check out today’s economic calendar with a full rundown of releases. And note that the charts below are from our premium service and shared exclusively with See It Market readers.
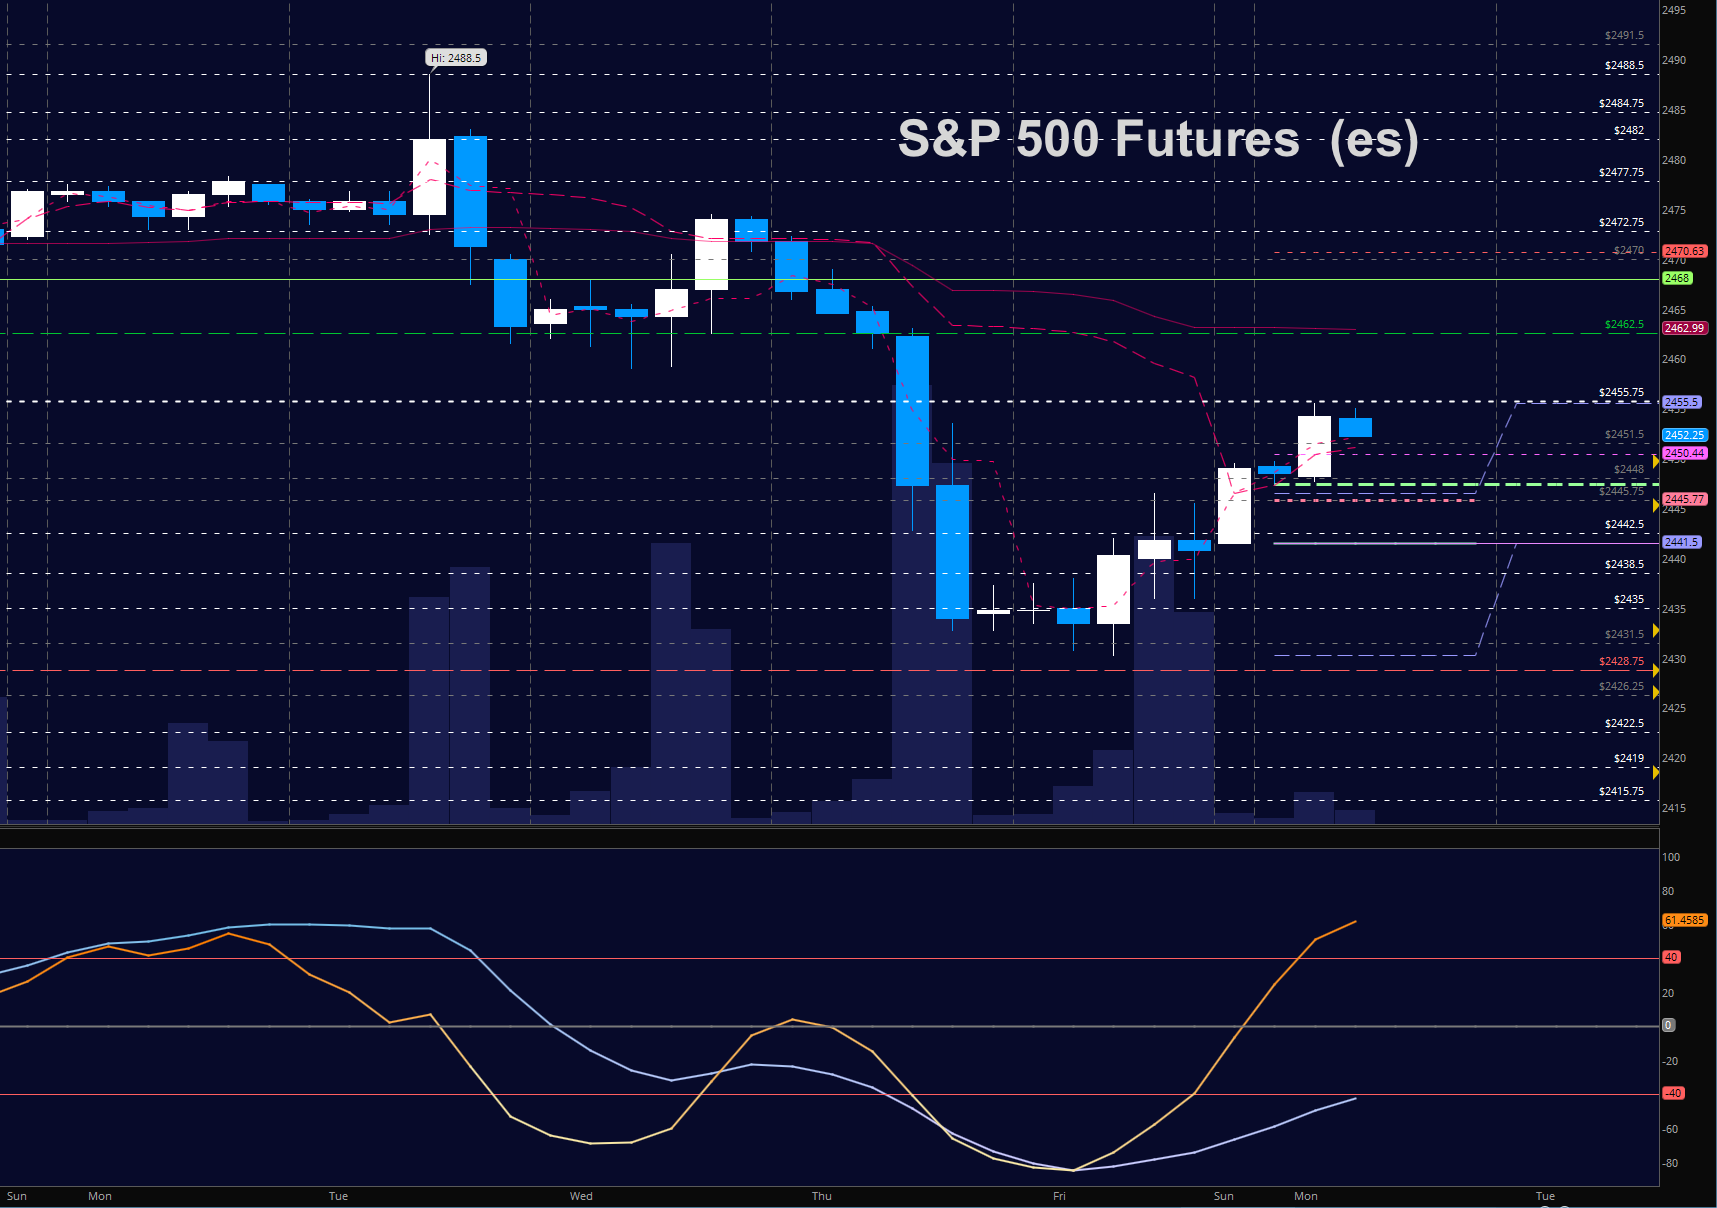
S&P 500 Futures (ES)
INITIAL TEST OF RESISTANCE OF 2455.75 is being met with sellers that will likely force us back to 2445 or so. We are likely to fail bounces today but a watchful eye for higher support building will confirm further upside potential. The bullets below represent the likely shift of trading momentum at the positive or failed retests at the levels noted.
- Buying pressure intradaywill likely strengthen above a positive retest of 2456
- Sellingpressure intraday will likely strengthen with a failed retest of 2440
- Resistance sits near 2456 to 2462.5, with 2468 and 2474 above that
- Support holds between 2440.25 and 2437.5, with 2434.5 and 2418.75 below that
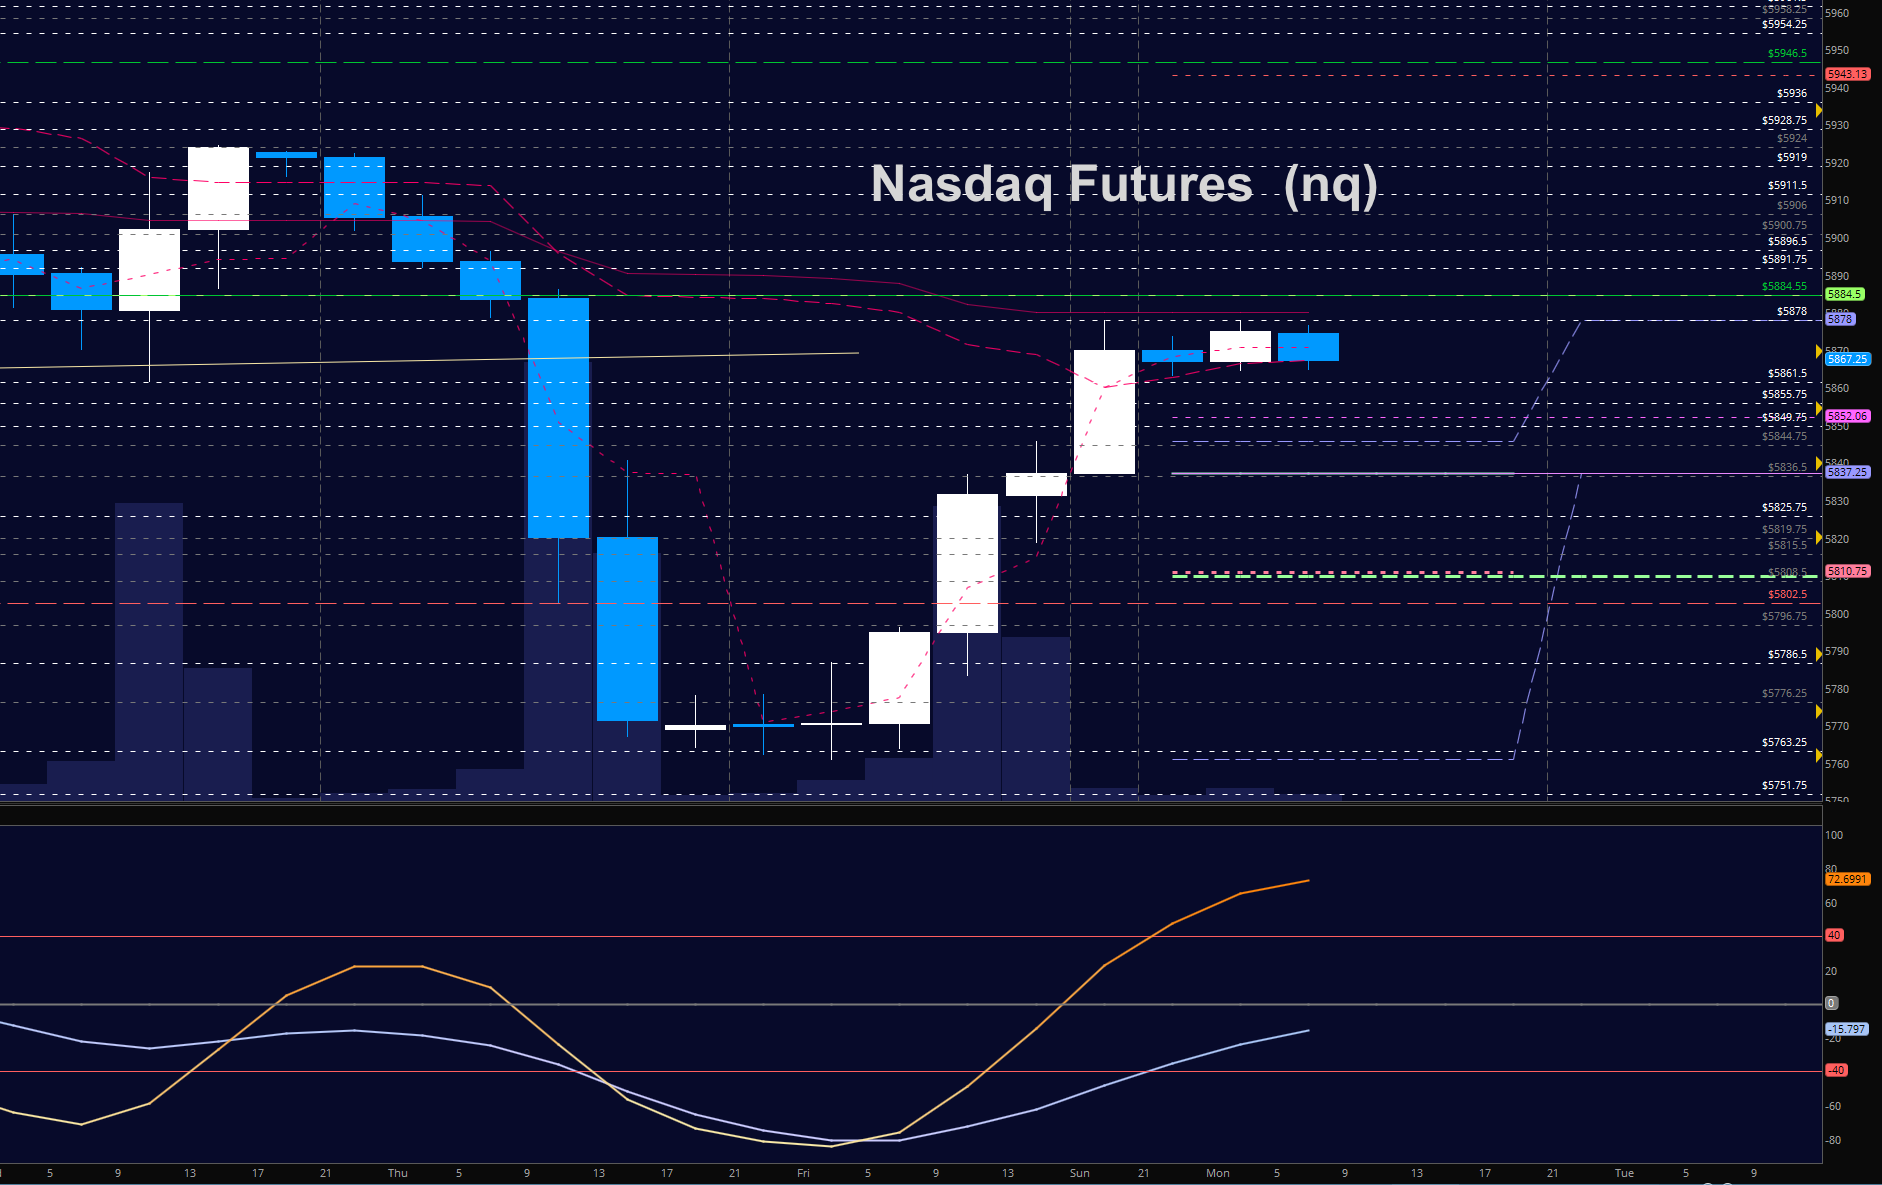
NASDAQ Futures (NQ)
RESISTANCE TEST OF 5878 is failing at present but we are likely to create higher lows in the current formation. We have a 40 range of motion that could hold today for us. The bullets below represent the likely shift of intraday trading momentum at the positive or failed tests at the levels noted –
- Buyingpressure intraday will likely strengthen with a positive retest of 5884
- Sellingpressure intraday will likely strengthen with a failed retest of 5844
- Resistance sits near 5878 to 5882.5, with 5896.5 and 5917.5 above that
- Support holds between 5861 and 5844.5, with 5832.75 and 5810.75 below that
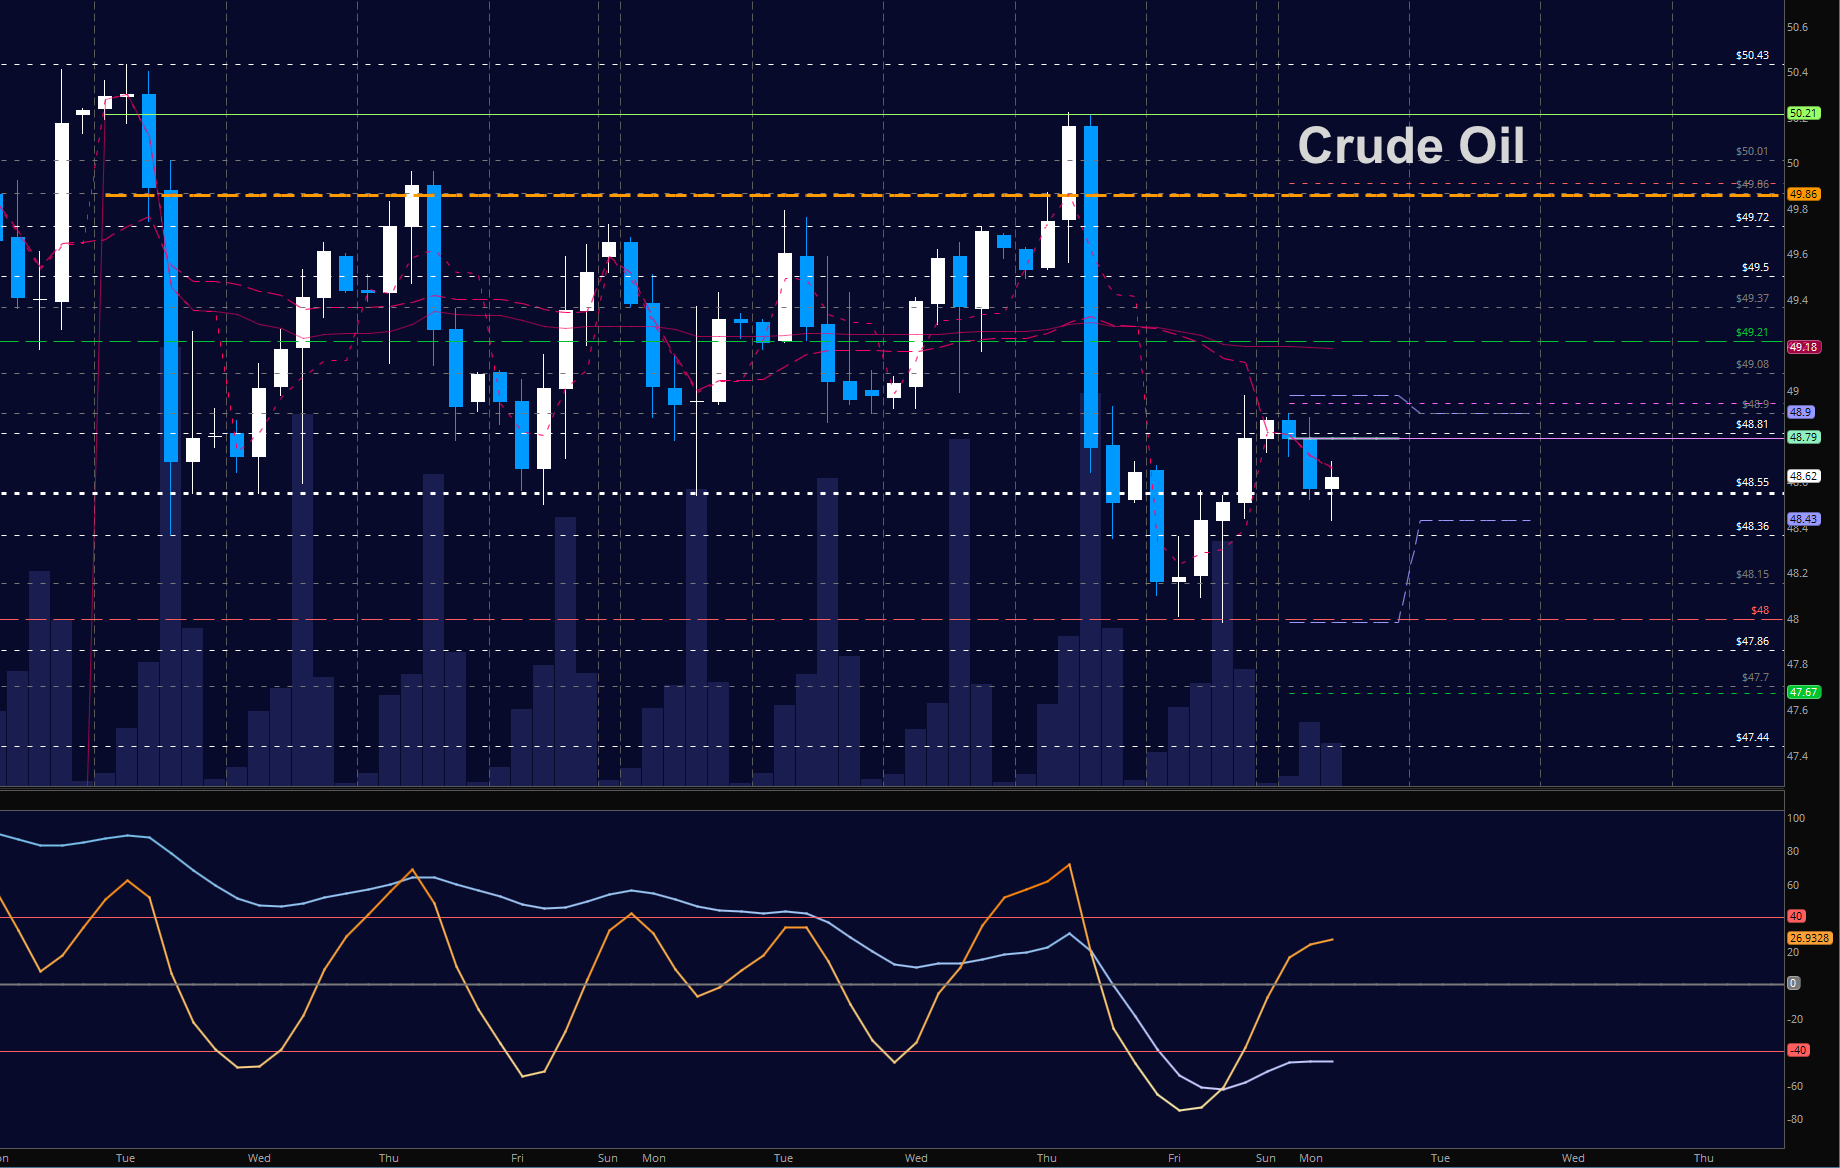
WTI Crude Oil
SUPPORT STRUGGLES TO HOLD 48.55 AS TRADERS TRY TO PROP up price. Momentum is negative. Failure to recapture 48.55 and hold leaves the chart quite bearish. The bullets below represent the likely shift of trading momentum at the positive or failed tests at the levels noted.
- Buyingpressure intraday will likely strengthen with a positive retest of 49.1
- Sellingpressure intraday will strengthen with a failed retest of 48.36
- Resistance sits near 48.74 to 48.9, with 49.21 and 49.59 above that.
- Support holds between 48.4 to 48.15, with 47.99 and 47.67 below that.
If you’re interested in watching these trades go live, join us in the live trading room from 9am to 11:30am each trading day. Visit TheTradingBook for more information.
If you’re interested in the live trading room, it is now primarily stock market futures content, though we do track heavily traded stocks and their likely daily trajectories as well – we begin at 9am with a morning report and likely chart movements along with trade setups for the day.
As long as the trader keeps himself aware of support and resistance levels, risk can be very adequately managed to play in either direction as bottom picking remains a behavior pattern that is developing with value buyers and speculative traders.
Twitter: @AnneMarieTrades
The author trades stock market futures every day and may have a position in mentioned securities at the time of publication. Any opinions expressed herein are solely those of the author, and do not in any way represent the views or opinions of any other person or entity.


