Stock Market Outlook for May 2, 2016 – A look at the monthly chart for S&P 500 futures (ES_F) still shows bullish weight with mild negative divergence. The weekly chart will confirm this, so long as we hold, and/or recover the 2045 region as support.
After bouncing off support last week, S&P 500 futures now hold the congested region just above 2061.25, but under negative momentum. If we are able to keep the 2057.75 area as support, buyers will be more likely to add steam to the retrace upward. If not, we’ll see 2054.5, 2051.5 and back to revisit Friday’s 2046 area. If buyers completely step out of the way, we’ll have that move into 2042 to 2031. The chart will be vulnerable to sell-off as long as we stay below 2078.25.
Momentum on the four hour chart is negative, suggesting that bounces will be sold. I’m looking at the 2071.5 retest to complete the current bounce action. Reversals are likely to be staged near this area. Failure to drift below 2060 give buyers the chance to plant a foothold that will force price action to the north again.
See today’s economic calendar with a rundown of releases.
THE RANGE OF MONDAY’S MOTION
Crude Oil Futures (CL_F)
Outlook for Crude Oil on May 2, 2016 – Oil prices continue to recover and are now approaching a monthly congestion event as we begin May. Bullish activity could push this one all the way to 49.5, but there is significant overhead supply between our current levels and that mighty one ahead. Recapturing 50 seems like something buyers would like to accomplish in the frames ahead. Support for crude oil seems quite strong at 44.45, so we’ll need to make sure that holds, or recovers quickly in the event of failure.
Upside motion in crude oil futures is trending currently, but the chart is quite near resistance for now, and a lower high or failure to breach 46.2 will suggest a reversal event is on the horizon.
So far, the best setup I see on crude oil futures, is on the positive retest of 45.7 (but with your eyes on where sellers show up above in case a reversal is actually brewing), or a bounce off 45.15 with positive momentum. I often use the 30min to 1hr chart for the breach and retest mechanic. Targets from 45.15 are 45.4, 45.68, 45.89, 46.04, 46.2, 46.44, 46.75, and if we can catch a bid there, we could expand into 47.03 to 47.54.
Downside motion on crude oil futures opens below the failed retest of 45.46 or at the failed retest of 46.44 with negative divergence. The failed double top may work nicely if momentum confirms a weak test across time frames. Retracement into lower levels from 46.1 gives us the targets 45.94, 45.72, 45.56, 45.46, 45.24, 45.15 and perhaps 44.85 to 44.48.
E-mini S&P 500 Futures (ES_F)
Below is a S&P 500 futures chart with price support and resistance trading levels for today. Click to enlarge.
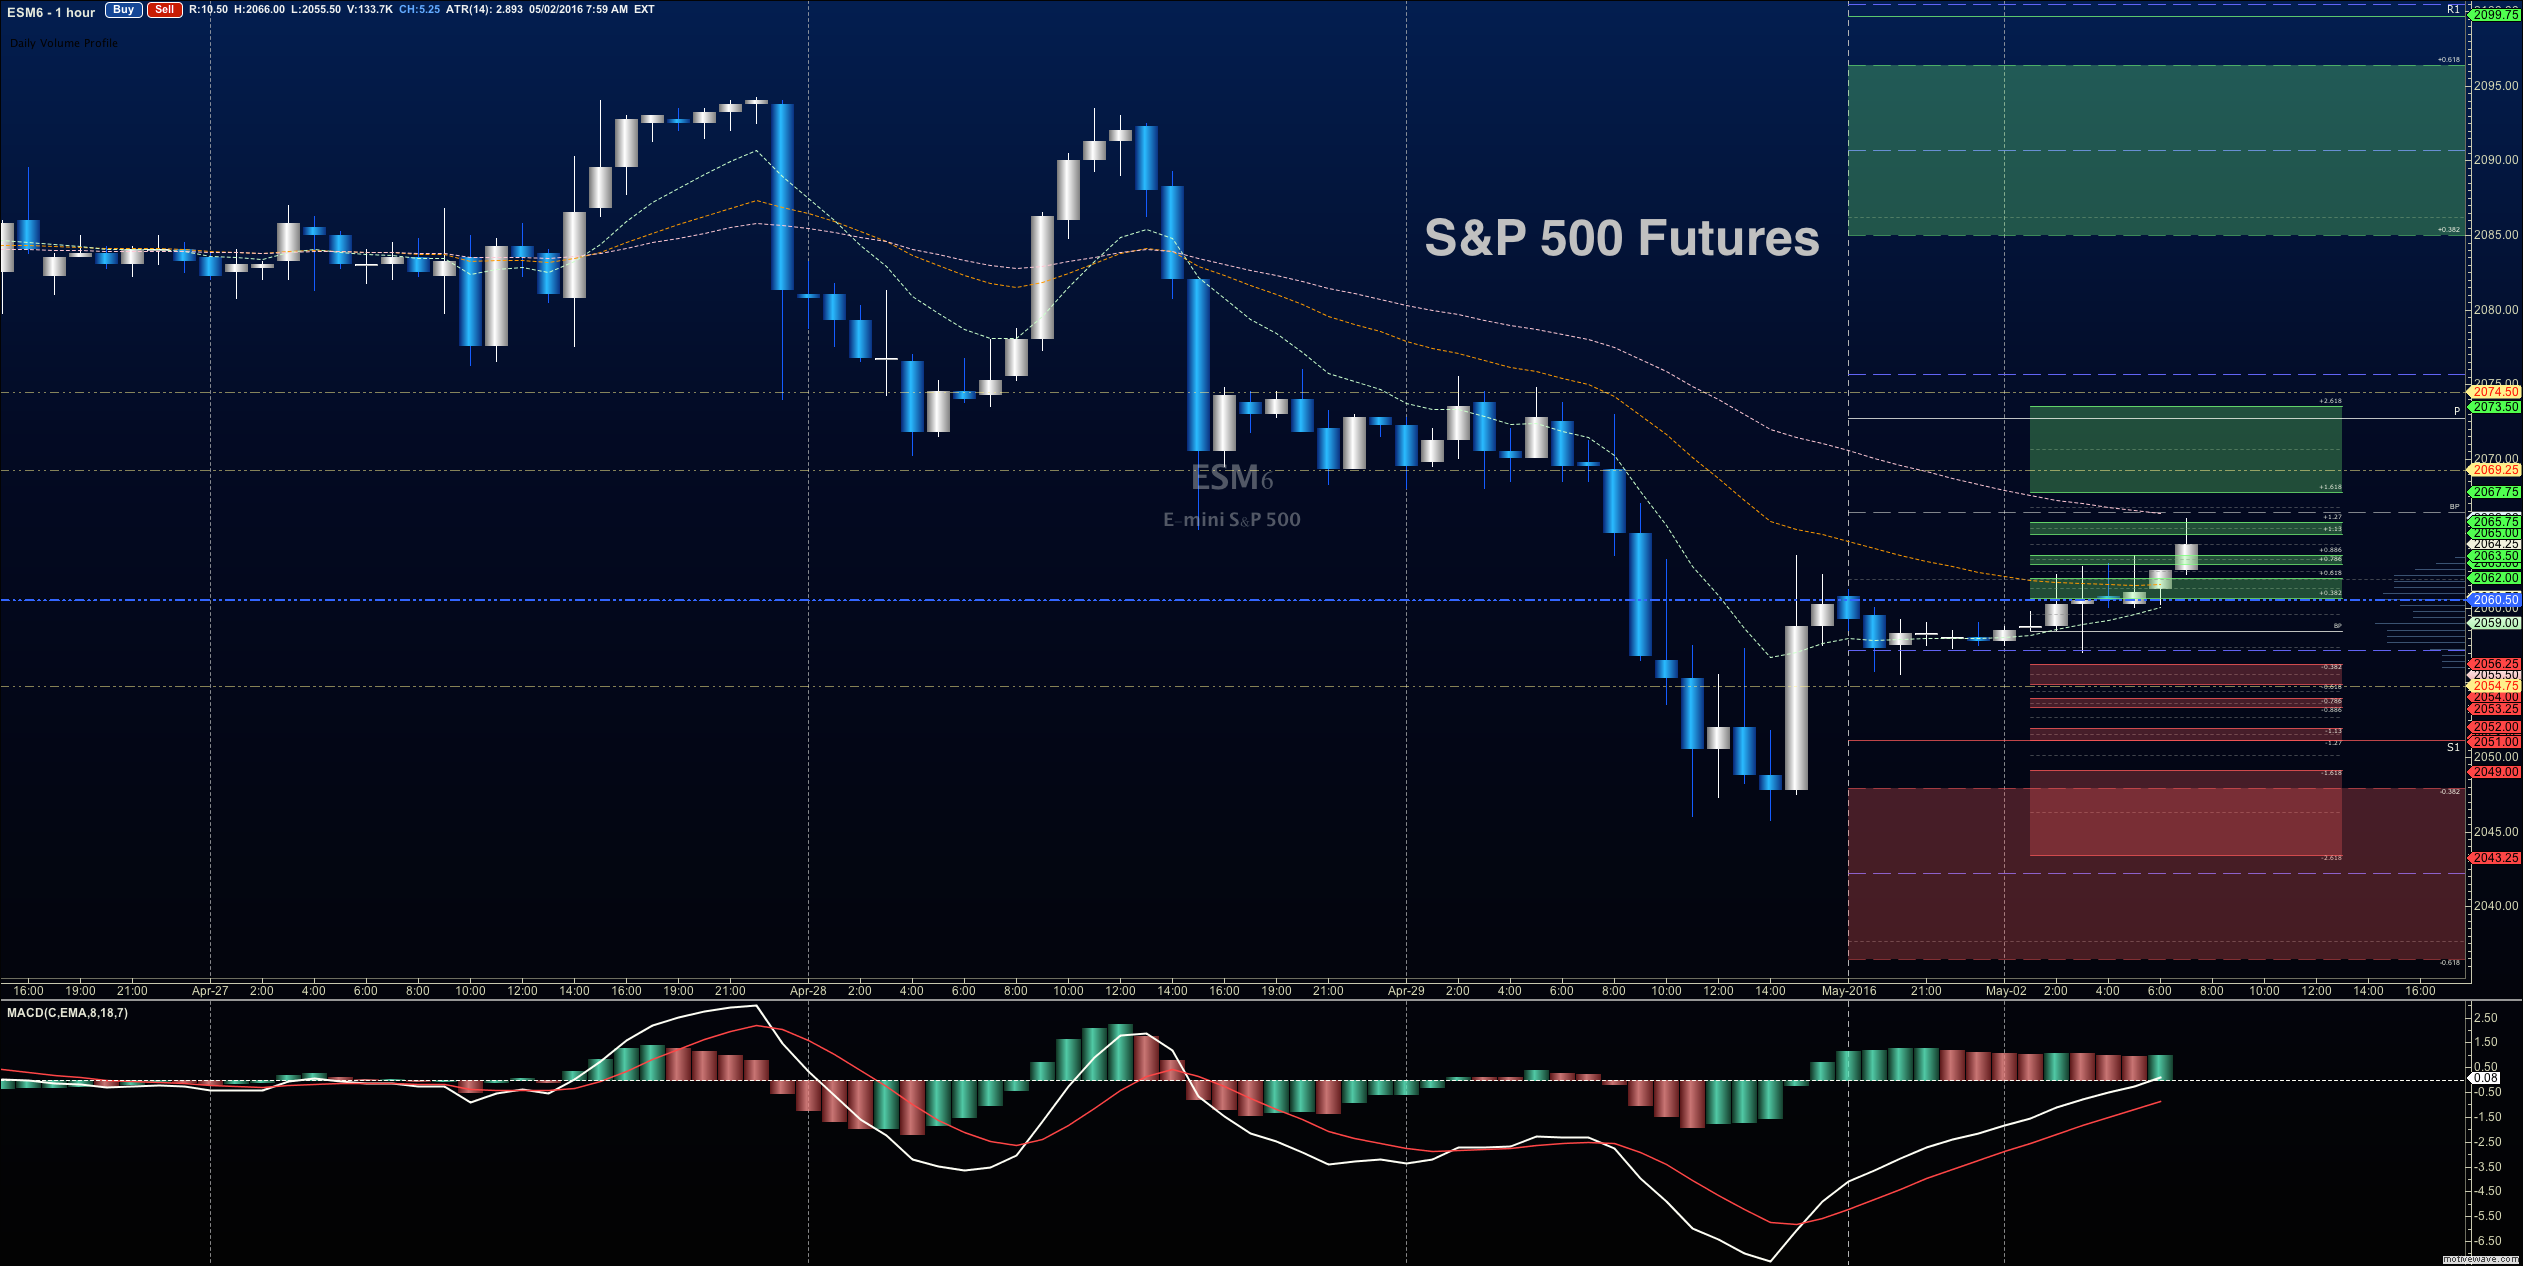
S&P 500 futures outlook for May 2, 2016 – Generally negative momentum with negative trend but with the charts at support, we could see bounce action before any reversals take place. We are currently in a bounce action event off Friday’s lows.
Upside motion is countertrend at the moment with the 4hour time frame in mind, but has the best setup on the positive retest of 2067.75 (over all that congestion), or a bounce off 2064.75 with positive momentum – keep your eyes on 2071.25 with this 2067.75 entry. I use the 30min to 1hr chart for the breach and retest mechanic. Targets from 2071.75 are 2074.5, 2077.75, 2082.25, 2086.5, 2089.5, 2092.25, and if we can catch a bid there, we could expand into 2094.5 to 2097.75.
Long action is still trending over the bigger picture for now, but momentum continues to slow, and pullbacks seem quite frequent at resistance zones.
Downside motion on S&P 500 futures opens below the failed retest of 2060.25 or at the failed retest of 2071.25 with negative divergence. There may be a very nice short waiting at the top of the current congested range but watch for higher lows forming to let you know that buyers are advancing their agenda. Retracement into lower levels from 2071.25 gives us the targets 2069.25, 2067.5, 2064.5, 2061.5, 2057.75, 2054.5, and perhaps 2051.25 to 2046.75.
If you’re interested in the live trading room, it is now primarily stock market futures content, though we do track heavily traded stocks and their likely daily trajectories as well – we begin at 9am with a morning report and likely chart movements along with trade setups for the day.
As long as the trader keeps himself aware of support and resistance levels, risk can be very adequately managed to play in either direction as bottom picking remains a behavior pattern that is developing with value buyers and speculative traders.
Twitter: @AnneMarieTrades
The author trades stock market futures every day and may have a position in mentioned securities at the time of publication. Any opinions expressed herein are solely those of the author, and do not in any way represent the views or opinions of any other person or entity.

: Worrisome to Broader Market?")


