The Morning Report: Market Buyers Struggle At Bounce Zone
The futures markets are bouncing after another nasty drop into the primary support zone near 1930. Though yesterday’s support broke, it recovered with S&P 500 futures bouncing off the lows this morning but not without sellers really trying to exert control.
There is a great deal of resistance ahead at 1961, and at 1968 at this juncture. Though, we sit at bounce zones just like yesterday, it will matter where the bounce fails – we expect only tests of resistance and not reversals until the charts can give us a cycle of higher lows and higher highs.
Intraday resistance sits near 1969. Intraday support sits at 1930. Breaks of either support or resistance must be tested and held on tighter time frames (30min/1hr) for trending trades on the day to hold. Buyers are still trapped so bounces should be sold near resistance (interim resistance sits at 1961). We have bearish momentum formations, but they are lifting as we try to firm up support near this very important level near 1930.
Shorter time frame momentum indicators are negative, and higher than Thursday. Longer cycles are downward trending and in negative territory.
See today’s economic calendar with a rundown of releases.
RANGE OF TUESDAY’S MOTION
Crude Oil Futures (CL_F)
Oil prices finally had a day it held the morning lows as it progressed through yesterday. It is in a relief bounce like many of the markets and charts. Bounces should be into resistance but price action is jagged and swinging wildly so taking the trade of the failure of resistance for short or vice versa for long is best in my mind. Trading ranges are between 32.73 and 34.49, with 33.12 being an important support level to hold.
Moving averages in oil are still clearly negative on longer time frames, and momentum is securely negative and very expanded. This is the likely formation creating opportunities for buyers to attempt bottom picking – only good for the short term at this time. Inflection levels are often quite difficult to trade so use caution. Intraday trade setup suggests a long off 33.15 (counter trend big picture but holding from an inflection perspective) into 33.3, 33.54, 33.89, and perhaps 34.1 and 34.6– see the blog for levels above that region. Below a 33 failed retest or a rejection of the 33.7 area sends us to 33.57, 33.35, 33.15, 32.8, 32.77, 32.42, 32.1, 31.47, and 30.6 perhaps as the next support space – Momentum on longer time frames is negative but lifting.
E-mini S&P 500 Futures (ES_F)
Below is a new chart with active S&P 500 futures price support and resistance trading levels. Click to enlarge.
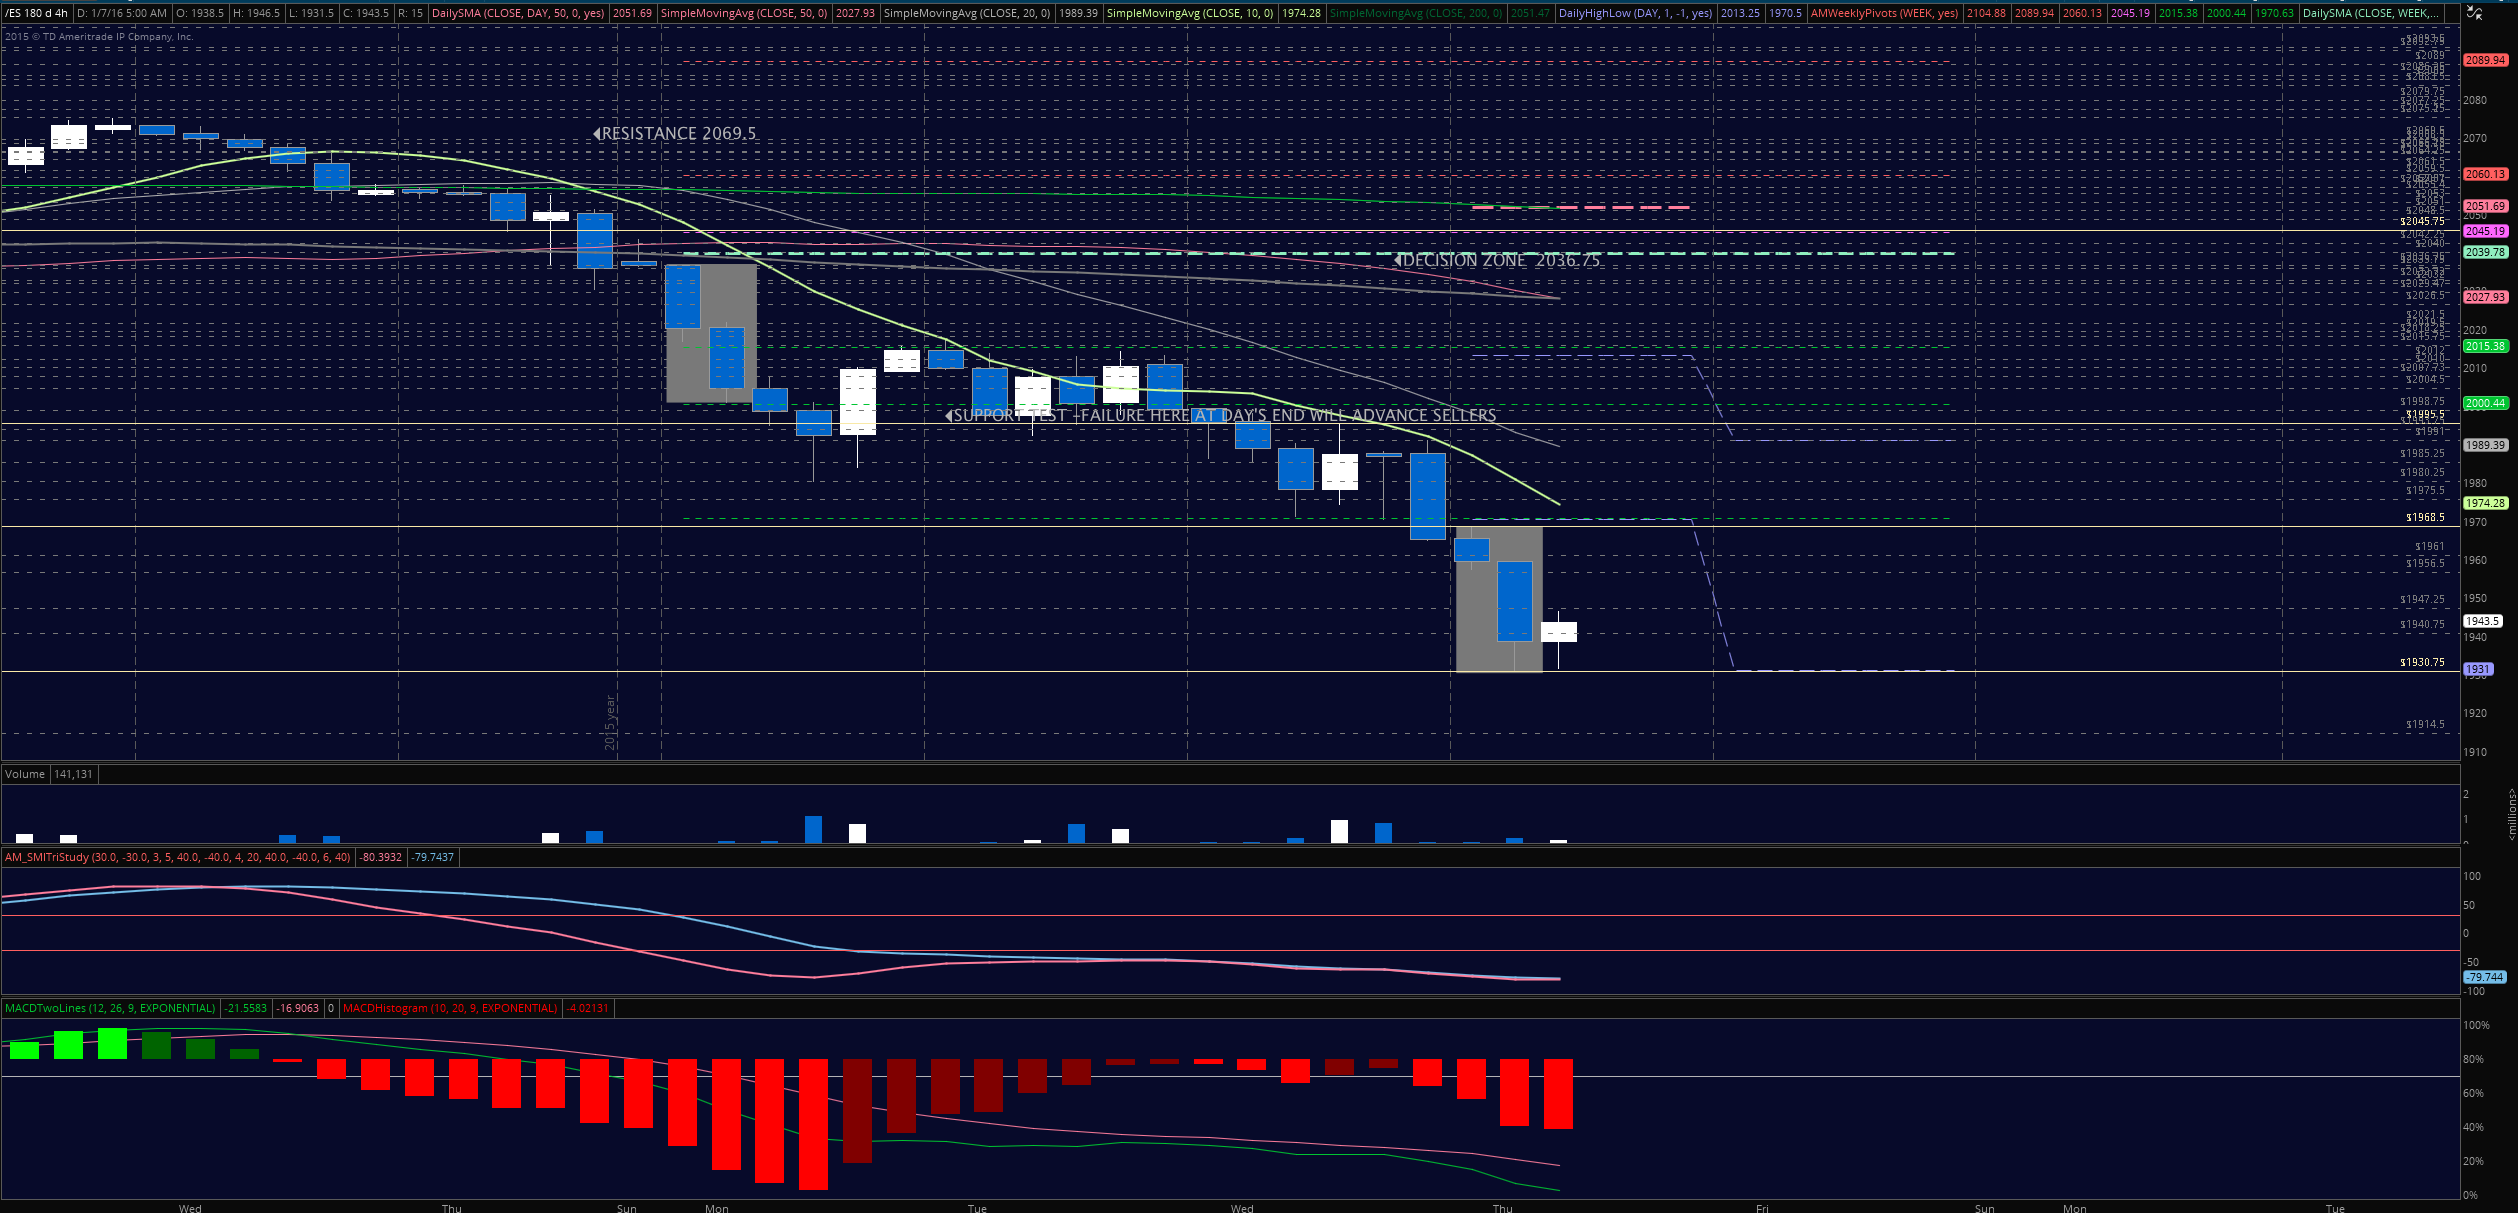
The premarket ranges for S&P 500 futures often provide for good trading days after the open. Upside motion has the best setup on the breach of and positive retest of 1940.5 – or a bounce off 1938.5 (as long as momentum shows this as likely to hold – this would be attempting to pick the bottom so close attention to the chart is required). Targets near 1945.5, 1947.5, 1950.75, 1956.5, and 1961.75 seem likely if the bounce holds – but again, all bounces should run into resistance. Watch 1968.5- 1974 for sellers to try to reverse the trend of the bounce. Long trades are counter trending at this writing but the chart could be inflecting from an intraday perspective -pullbacks into higher lows may reverse the intraday trend.
Downside motion opens below the failed retest of 1936.5 or at the failure to hold 1961 bounce. Retracement into lower levels from 1936.5 gives us the targets at 1932.25, 1930.75, 1928.75, 1925.75, and perhaps 1922.75. There is another very important support level near 1914.
Short action intraday is trending currently unless we have a bounce and positive retest of 1956.75 with momentum shifts.
If you’re interested in the live trading room, it is now primarily futures content, though we do track heavily traded stocks and their likely daily trajectories as well – we begin at 9am with a morning report and likely chart movements along with trade setups for the day.
As long as traders keep themselves aware of support and resistance levels, risk can be very adequately managed to play in either direction as bottom picking remains a behavior pattern that is developing with value buyers and speculative traders.
Twitter: @AnneMarieTrades
The author trades futures every day and may have a position in mentioned securities at the time of publication. Any opinions expressed herein are solely those of the author, and do not in any way represent the views or opinions of any other person or entity.


: Creating Bullish Divergence?")


