The March 1 outlook for S&P 500 futures shows price resistance dead ahead. An impressive overnight rally under negative divergence greets us this morning.
1948 – 1954.5 represents near term resistance and charts are significantly expanded to make rejection of these regions quite likely.
The Morning Report: S&P 500 Futures Into Resistance Once More
Momentum on the four hour chart is sloping negative, and in neutral territory – range based trading formations. Daily charts of the S&P 500 Futures read momentum as trending mildly positive, and in positive territory but drifting into support lines– suggesting support levels will bring buyers to the rescue once more.
Shorter time frame momentum indicators are sitting in negative territory, and sloping up. Negative divergence is present but charts continue to hold moving averages. This is usually the litmus test.
See today’s economic calendar with a rundown of releases.
THE RANGE OF TUESDAY’S MOTION
Crude Oil Futures (CL_F)
Buyers of Crude Oil are trying to prop price up here irrespective of fundamental undercurrents. Pullbacks show buyers at the ready to defend support. New support 34.07-34.2 – price pressure seems strong, but negative divergence is present.
Today, the trading ranges for crude oil futures are between 33.85 and 35.15. Expansions outside those zones will retest, and if held will advance in the direction of the break.
Moving averages in oil show us at a decision zone with increasing positive momentum. This generally gives rise to buyers showing up when it seems like the chart will roll. Charts have breached moving averages that have created areas of resistance that will now act as support and give buyers courage to advance price.
Intraday long trading setups on crude oil futures suggest a long off 34.25 positive retest, or 33.89 bounce into 34.09, 32.26, 34.46, 34.78, 35.05 and if buyers hold on, we’ll see 35.35 to potentially 35.75.
Intraday short trading setups for crude oil suggest a short below a 34.48 failed retest with negative divergence, or the failed retest of 33.85 sends us back through familiar targets to 34.14, 33.76, 33.45, 33.23, 32.87, 32.59, 32.35, 32.02
Have a look at the Fibonacci levels marked in the blog for more targets.
E-mini S&P 500 Futures (ES_F)
Below is a S&P 500 futures chart with price support and resistance trading levels for today. Click to enlarge.
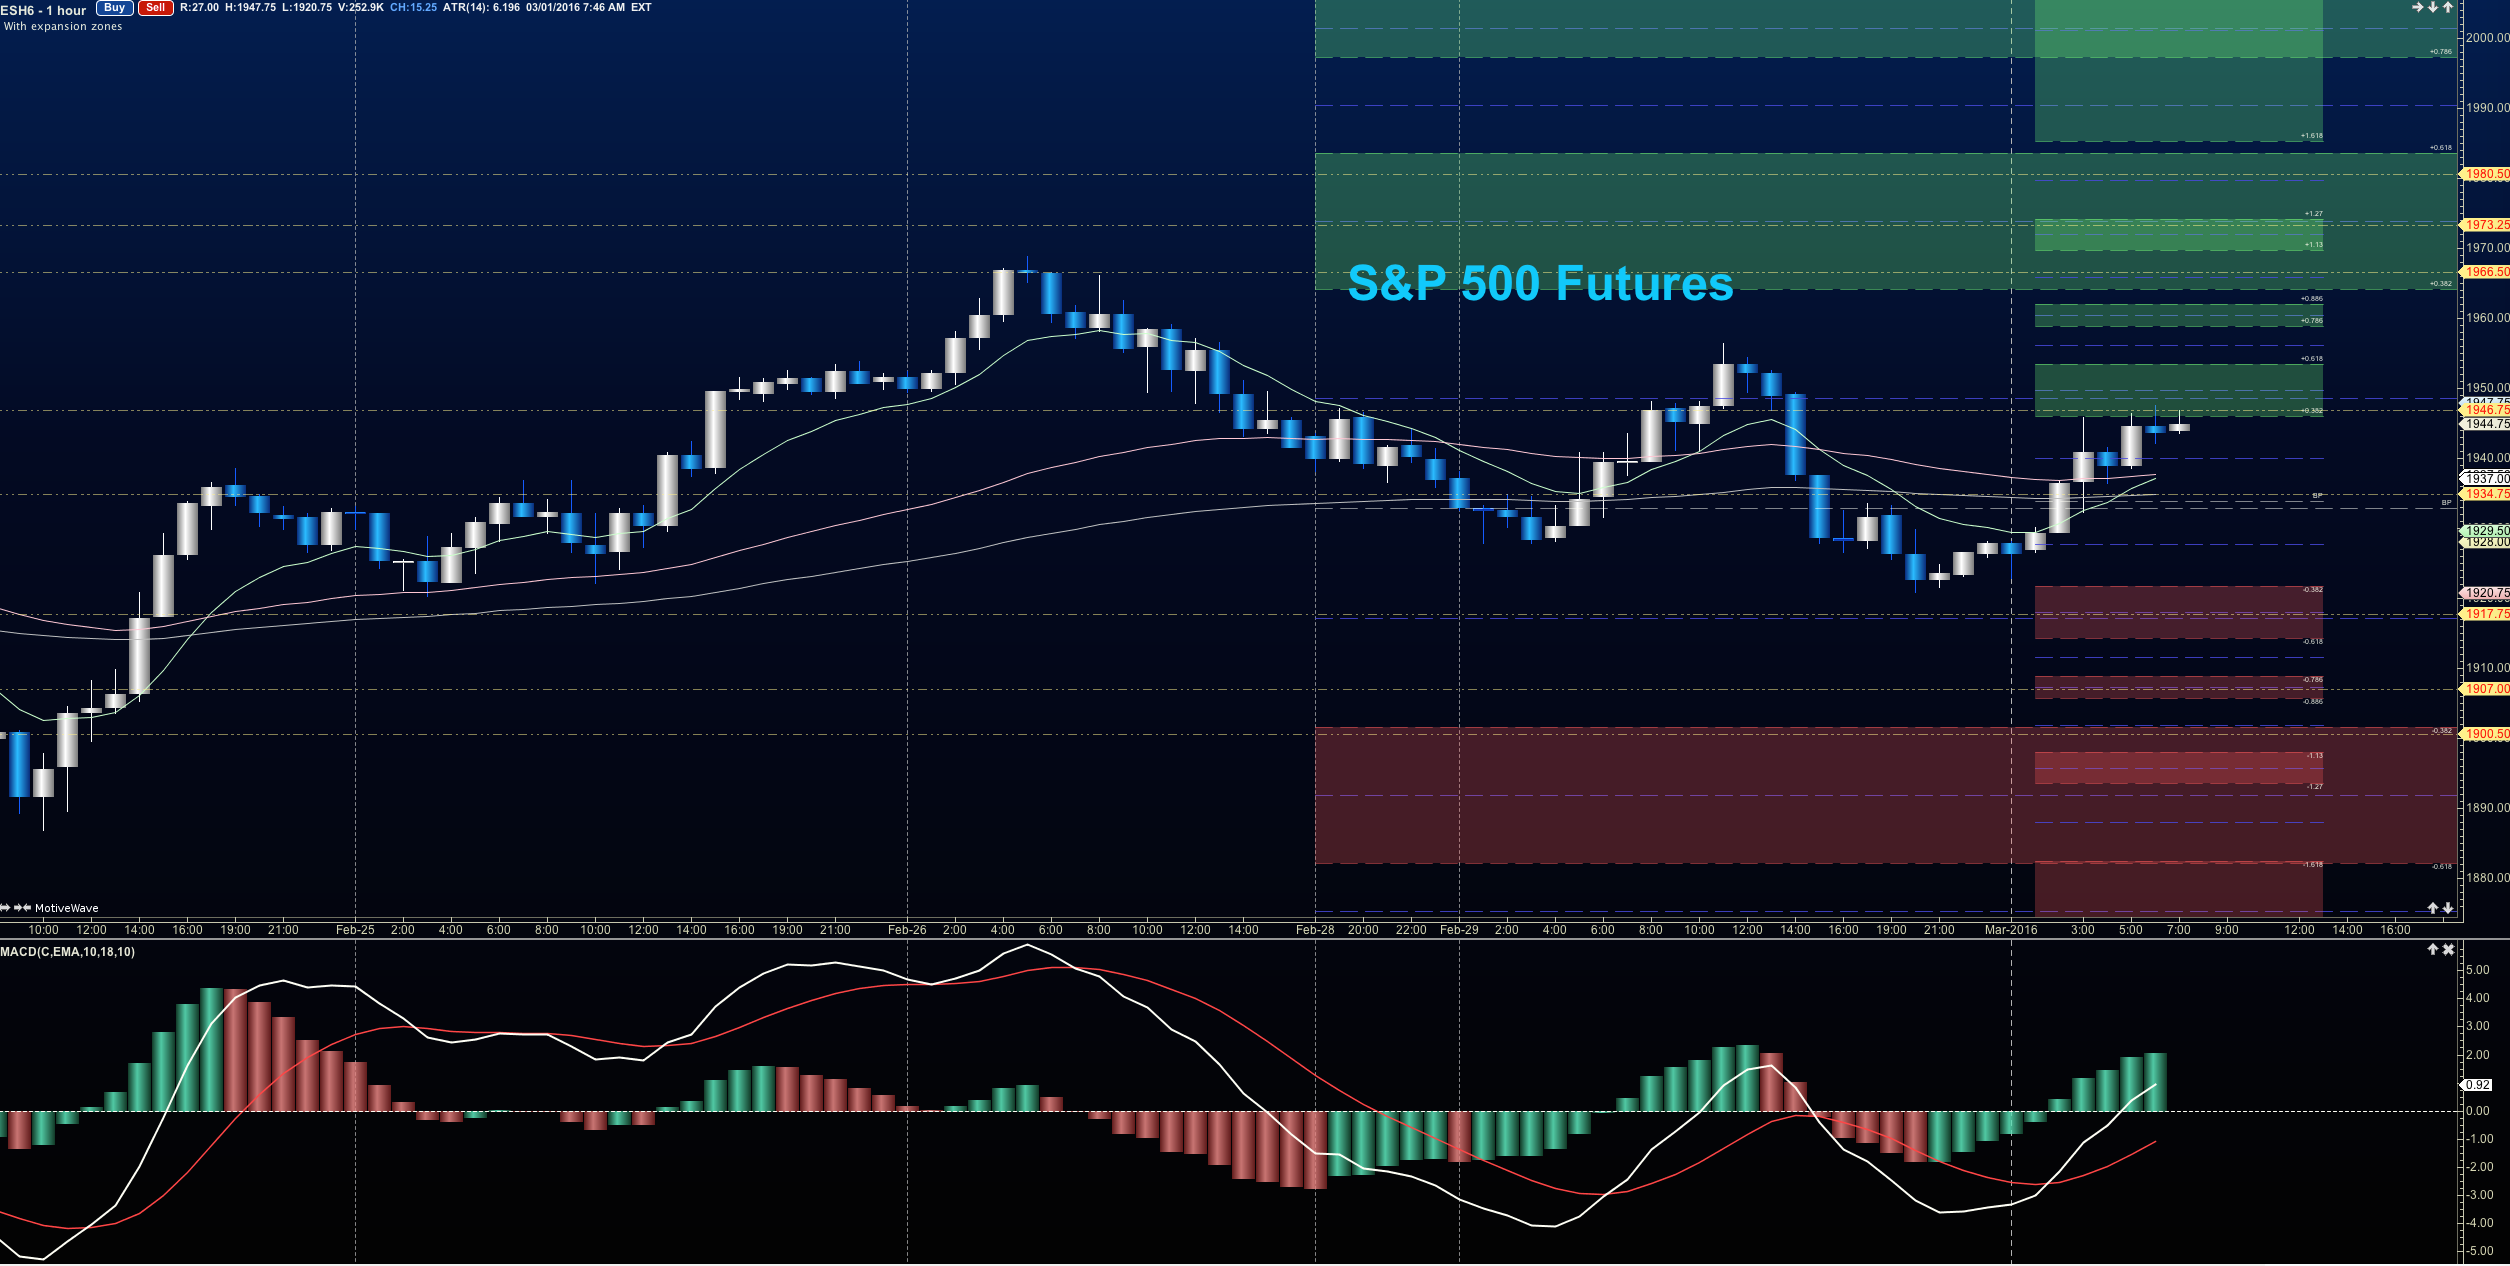
S&P 500 futures are pushing higher again as we start the month of March. Range based trading continues with a 78.6% retracement of yesterday’s wave down. Charts are very messy but the bullish undercurrent shows up again in overnight trading. Pullbacks should find buyers.
Upside motion for S&P 500 futures has the best setup on the positive retest of 1939.5 or a breach and successful retest of 1940.5. I use the 30min to 1hr chart for the breach and retest mechanic. Price targets from 1939.5 are 1941.5, 1944.5, 1948.75, 1951.25, 1954.5, 1958.75, 1961.75 and if we can catch a bid there, we could expand into 1964.5-1974. Big resistance test sits at the region between 1972-1974. Watch the higher lows to keep you on the right side of the long trade. Charts are firming up, but are likely exhausted here so we should see a bit of a sideways patch-keep that long undercurrent in mind, as it still appears on the daily and weekly time frames.
Downside motion opens below the failed retest of 1940.5 or at the failed retest of 1947 with negative divergence. Retracement into lower levels from 1947 gives us S&P 500 futures price targets of 1943.5, 1940.5, 1934.75, 1929.25, 1922.5, 1918, 1915.75, 1914, and perhaps 1904.75 if selling really takes hold.
Have a look at the Fibonacci levels marked in the blog for more targets.
If you’re interested in the live trading room, it is now primarily futures content, though we do track heavily traded stocks and their likely daily trajectories as well – we begin at 9am with a morning report and likely chart movements along with trade setups for the day.
As long as traders remain aware of support and resistance levels, risk can be very adequately managed to play in either direction as bottom picking remains a behavior pattern that is developing with value buyers and speculative traders.
Twitter: @AnneMarieTrades
The author trades stock market futures every day and may have a position in mentioned securities at the time of publication. Any opinions expressed herein are solely those of the author, and do not in any way represent the views or opinions of any other person or entity.


")


 Ready To Break Out?")