The Morning Report: Markets In Bounce Formations
Earnings season continues. There was more jagged overnight price action in stock market futures last night.
Looking at the S&P 500 futures, sellers have far less control of the charts now that we have recaptured the 1931 level. But another retest is quite likely and that is where the tale will be told. Failed resistance tests still seem likely ahead.
If the bounce holds, the next test of importance for the S&P 500 futures is 1961.
Charts began a cycle of higher lows and higher highs on short time frames yesterday so the march to resistance is foremost on the mind of traders engaged in the move up. What happens at the test of 1995 in the coming days will likely give us a good picture of what’s ahead… i.e. the future of the first quarter of 2016.
Intraday resistance for S&P 500 futures sits near 1947.25. Intraday support sits at 1922.5. Breaks of either resistance or support must be retested on tighter time frames (30min/1hr) for trending trades on the day to hold.
Futures bounces like the ones we seeing right now should be sold near resistance, but that could be all the way up at the 1961 level if S&P 500 futures hold a bid. We have bullish intraday momentum formations that look to be waning, as we try to hold support near this very important level near 1931.
Shorter time frame momentum indicators are positive, and higher than Tuesday. Longer cycles are still downward trending and holding steady in negative territory.
See today’s economic calendar with a rundown of releases.
THE RANGE OF TUESDAY’S MOTION
Crude Oil Futures (CL_F)
Crude Oil bounced hard after its flush at just below 30. Traders scrambled into position in hopes that the charts would hold. I suspect a bounce that carries to 32.62 or so. My commentary on technical divergence led me to position cautiously long as the afternoon continued. Once crude oil futures began to make higher lows and higher highs, we can trust momentum indicators to add to size. With sellers still in charge, resistance tests and failure into higher lows still the most likely occurrences today.
Trading ranges are between 30.10 and 32.62, with 31.55 being an important support level to recapture and hold.
Moving averages in crude oil are still clearly negative on longer time frames but are being tested at this writing. Momentum is securely negative but continues to lift and look divergent. If we are at an inflection point in the grand scheme, they are often quite difficult to trade so use caution.
Intraday trade setup suggests a long off a retest of 31.00 (counter trend big picture but holding from an inflection perspective) into 31.4, 31.6, 31.8, and 32.24 to 32.62– see the blog for levels above that region. Below a 30.80 failed retest or a rejection of the 31.7 area sends us to 31.47, 31,23, 30.96, 30.65, 30.4, and 29.8 perhaps as the next support space – Momentum on longer time frames is negative but lifting.
E-mini S&P 500 Futures (ES_F)
Below is a chart with active S&P 500 futures price support and resistance trading levels. Click to enlarge.
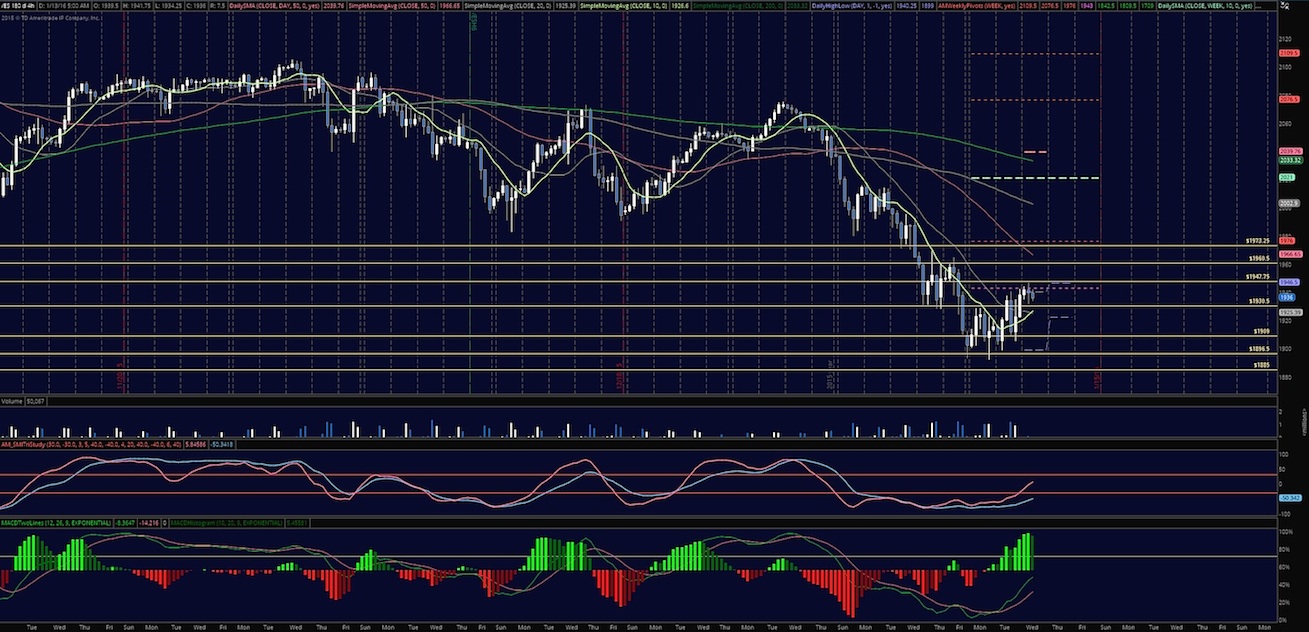
The chart of the S&P 500 futures is trying to bounce but resistance levels above remain selling zones: now near the 1947 level. Upside motion in market futures has the best setup on the breach of and positive retest of 1931.5 – or a bounce off 1927(as long as momentum shows this as likely to hold). Targets from 1927.5 -1929.5, 1931.5, 1936, 1940.5, 1946.5 and 1956.5 to 1961 if the charts continue to run above their moving averages on tight time frames. Watch 1947.5- 1956 for sellers to try to reverse the trend of the bounce, if the chart continues north over 1940.75. Long trades are trending intraday at this writing.
Downside motion for S&P 500 futures opens below the failed retest of 1930.25 or at the failure to hold 1943.75 bounce. Retracement into lower levels from 1943.5 gives us the targets at 1936.5, 1931.5, 1929.25, 1927.75, 1922.5, 1919.5, 1914.5 and perhaps 1910.75. Breaks there send us back to overnight lows near 1901 and 1893 of three days ago – I consider this extremely unlikely.
Short action intraday is trending currently unless we have a bounce and positive retest of 1931.75 holding current momentum patterns.
If you’re interested in the live trading room, it is now primarily futures content, though we do track heavily traded stocks and their likely daily trajectories as well – we begin at 9am with a morning report and likely chart movements along with trade setups for the day.
As long as the trader keeps himself aware of support and resistance levels, risk can be very adequately managed to play in either direction as bottom picking remains a behavior pattern that is developing with value buyers and speculative traders.
Twitter: @AnneMarieTrades
The author trades stock market futures every day and may have a position in mentioned securities at the time of publication. Any opinions expressed herein are solely those of the author, and do not in any way represent the views or opinions of any other person or entity.
: Creating Bullish Divergence?")


 and Semiconductors (SMH): Concerning Price Pattern?")


