Stock Market futures outlook for May 10, 2016 – S&P 500 futures have been somewhat volatile this morning stretching into resistance near 2069 and falling into higher support near 2058. Below this level of congestion, we see 2054.4 and 2051 as lower intraday support.
Momentum will be key here as price action tries to hold steady at these support regions between 2054.5 and 2051.75. The S&P 500 futures charts feel a bit bullish, but broken support will take upside off the table quickly. Formations today show, as they did yesterday, that pullbacks into support will hold and press north into resistance (currently near 2069.25 intraday).
As with this morning’s example, breakouts to the upside are unlikely to continue without retracing into support. The weekly target upside, if buyers maintain control, sits near 2071.75 to 2074 at this time.
If S&P 500 futures are able to keep the 2053.5 retest, buyers will be more likely to add steam to the retrace upward back into resistance near 2063.5, and 2067.5, before sellers try to force buyers back down. Heavy congestion resides up there intraday, and though we rejected it once today, we did expand briefly over the level, so I will be watching for higher lows to develop in order to prove out buying strength. If not, we’ll see that 2046-2048 again, as we did yesterday before bouncing. We are still range bound – and that means deep spikes down will bring buyers, and long spikes up will bring sellers.
Momentum on the four hour chart is still mixed between form and location, suggesting that bounces will be still be sold, and pullbacks will be bought. There seems to be quite a bit of buying power lurking beneath the surface here, but they are having a hard time holding traction. Several lines of sellers are still set to prevent the advance of price upward – 2062.5, 2064.5 and 2068.75. Support levels sit near 2044-2048.
See today’s economic calendar with a rundown of releases.
THE RANGE OF TUESDAY’S MOTION
Crude Oil Futures (CL_F)
Outlook for Crude Oil futures for May 10, 2016 – Note that there’s an API report after the close. Formations hold an undercurrent of selling momentum after a big run higher in oil prices. As well, lots of chatter seems very bearish on the financial streams. Extremely bearish sentiment always concerns me as a contra-indicator, so I’ll be watching how this region near 42.9 to 43.1 for crude oil futures holds as support.
Seems there are lots of buyers sitting in this region for now. The chart for oil appears to be range bound, and for me that often means that setups that look short will be long, and setups that look long will be short. Weeheeee ! Just be careful.
The trading range for crude oil suggests support action near 42.84, and resistance behavior near 44.54.
Upside trades can be staged on the positive retest of 43.9, or a bounce off 43.37 with positive momentum. I often use the 30min to 1hr chart for the breach and retest mechanic. Targets from 43.37 are 43.64, 43.94, 44.04, 44.27, 44.54, 44.76, 44.98, and if we can catch a bid there, we could expand into 45.43 to 45.94.
Downside trades for oil seem feasible below the failed retest of 43.2, or at the failed retest of 44.52 with negative divergence – careful to watch for higher lows at the short on the resistance level. Buyers are sitting all over this chart again this morning, but momentum suggests they are weak. Just keep an eye out for higher lows. Retracement into lower levels from 44.52 give us the targets 44.27, 44.04, 43.87, 43.62, 43.37, 43.07, 42.96, and perhaps 42.59, to 42.38, and 41.94.
E-mini S&P 500 Futures (ES_F)
Below is a S&P 500 futures chart with price support and resistance trading levels for today. Click to enlarge.
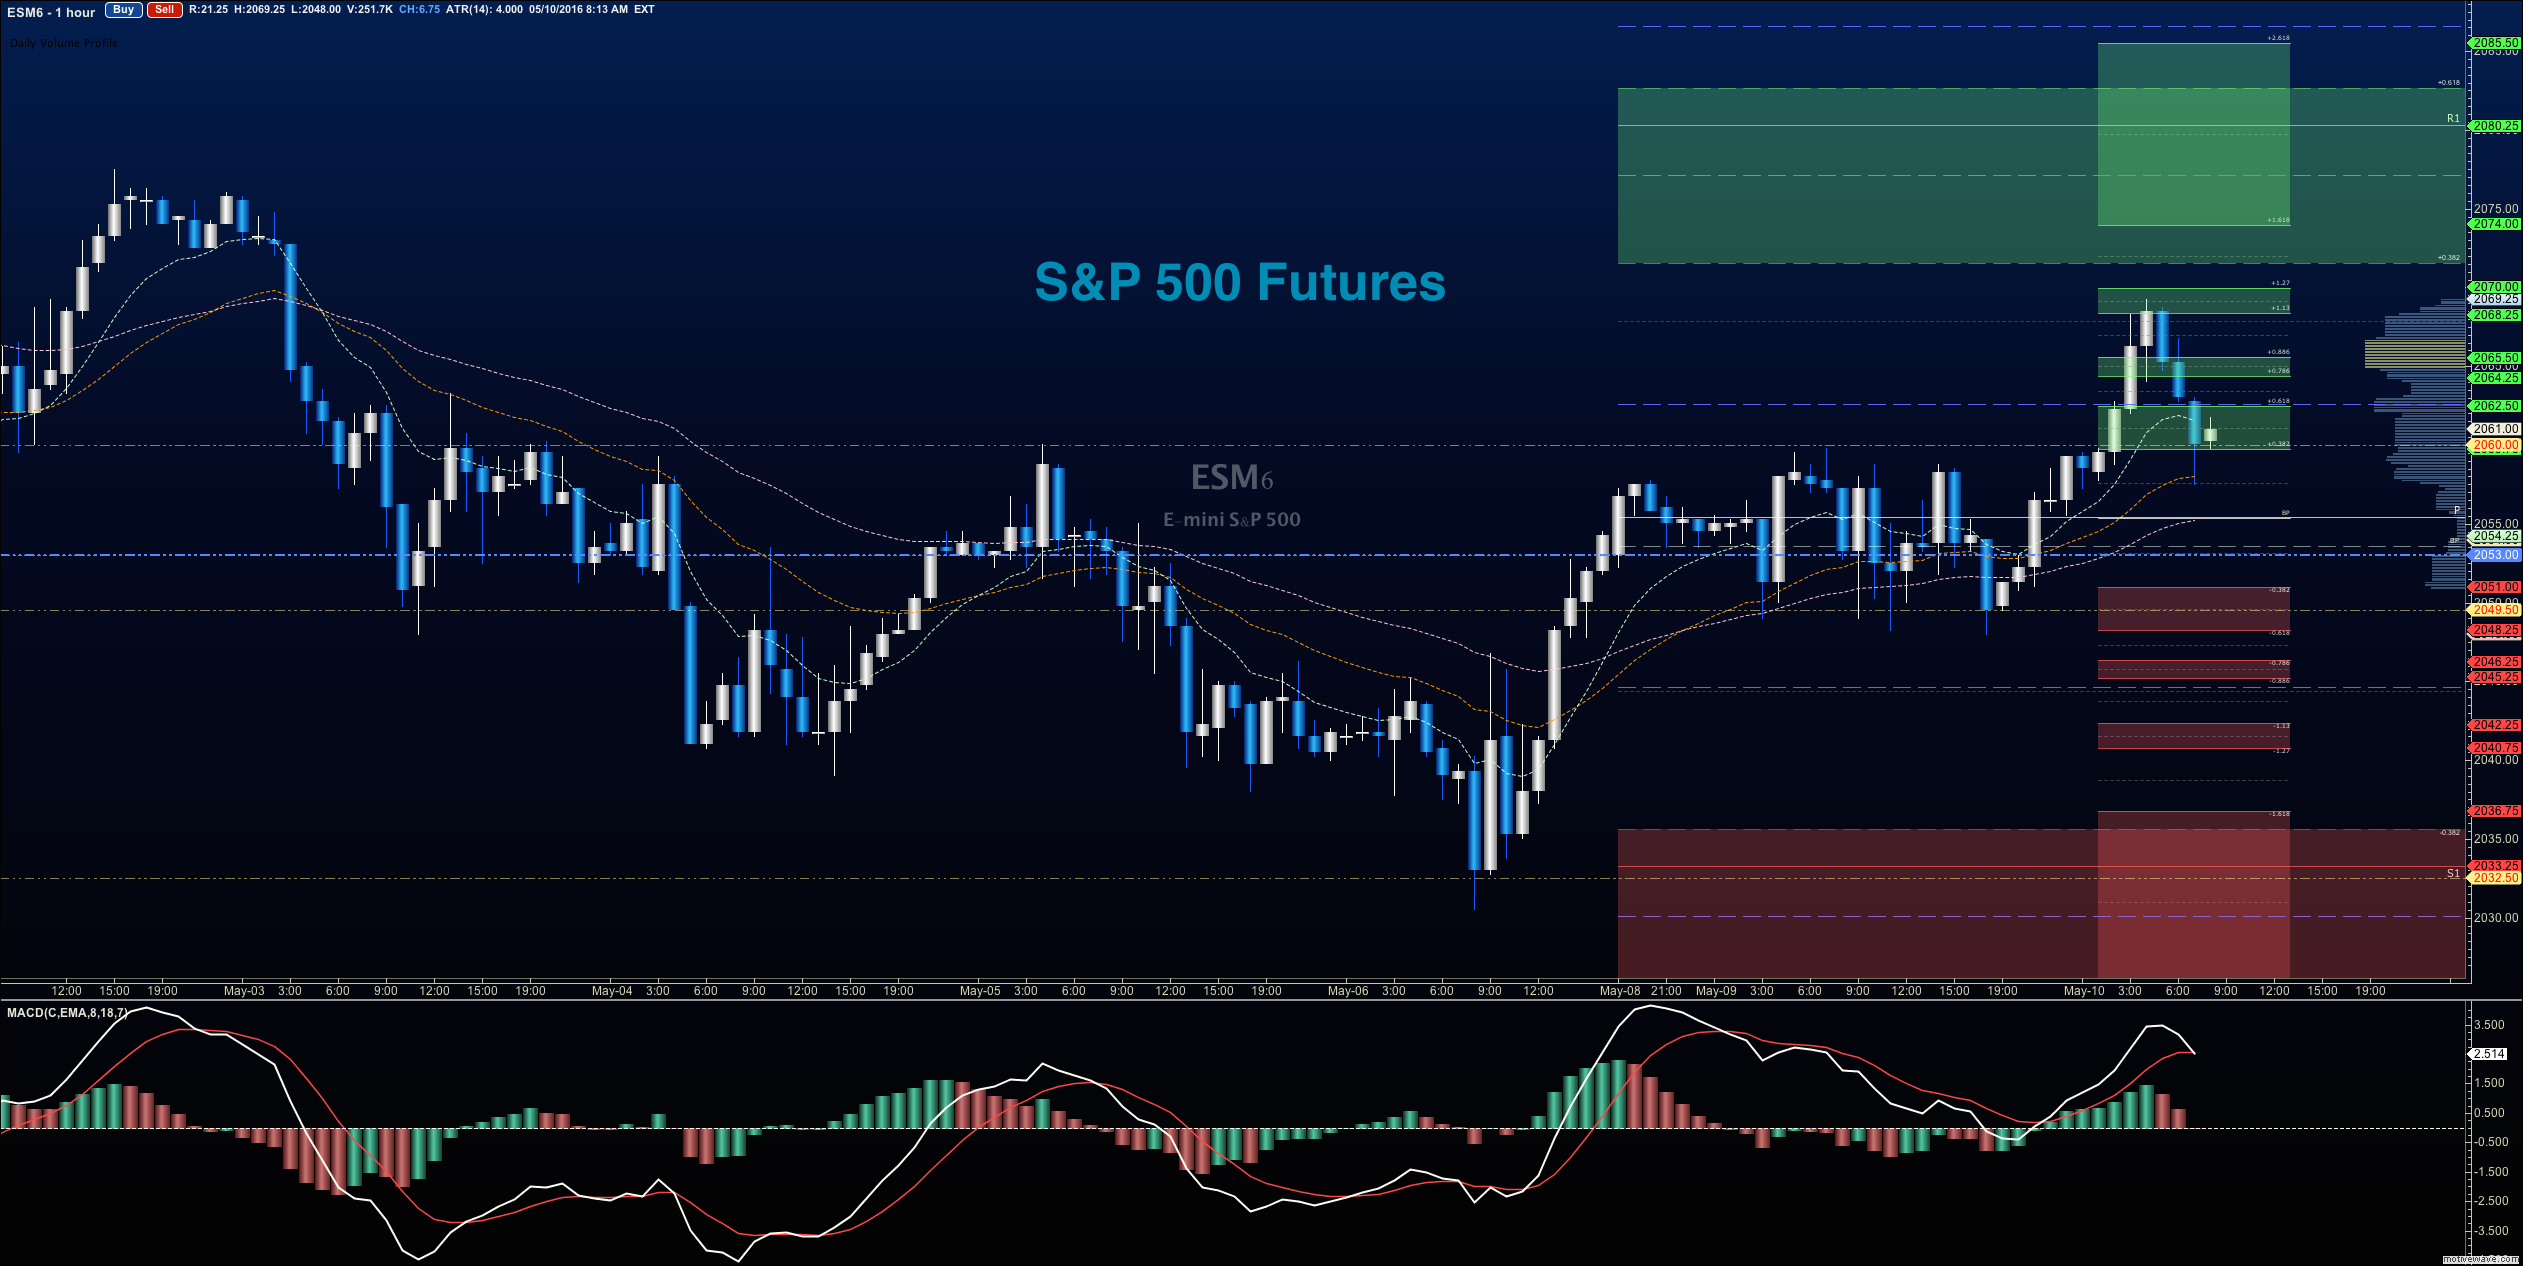
S&P 500 futures outlook for May 10, 2016 – Positive momentum with mixed trend that is drifting somewhat positive exists in the charts right now– that means messy trading, with wicks all around.
Upside trades will be into resistance, but the best setup sits on the positive retest of 2058.5, or a bounce off 2052.5 with positive momentum – keep your eyes on 2058.5 with this 2052.5 entry. I use the 30min to 1hr chart for the breach and retest mechanic. Targets from 2054.5 are 2057.25, 2059.25, 2061.75, 2064.25, 2067.5, 2069.25, and if we can catch a bid there, we could expand into 2071.5, 2073.25, 2075.5, and 2077.75.
Downside trades open below the failed retest of 2050.5 or at the failed retest of 2058 with negative divergence. We could also try shorting at the retest of 2068 but negative divergence really needs to be present there. Retracement into lower levels from 2058 gives us the targets 2056.25, 2053.75, 2051.75, 2047.75, 2044.5, 2042.5, 2039.5, 2035.5, 2037.25, 2034, and perhaps 2031.25 to 2029.25, though these downside targets seem quite unlikely at this writing.
If you’re interested in the live trading room, it is now primarily stock market futures content, though we do track heavily traded stocks and their likely daily trajectories as well – we begin at 9am with a morning report and likely chart movements along with trade setups for the day.
As long as the trader keeps himself aware of support and resistance levels, risk can be very adequately managed to play in either direction as bottom picking remains a behavior pattern that is developing with value buyers and speculative traders.
Twitter: @AnneMarieTrades
The author trades stock market futures every day and may have a position in mentioned securities at the time of publication. Any opinions expressed herein are solely those of the author, and do not in any way represent the views or opinions of any other person or entity.


 May Tip Stock Market’s Next Move")


