Stock market outlook for April 28 – The Bank of Japan surprised the markets dramatically by not making further moves to increase stimulus. The surprise sent the S&P 500 futures (ES_F) right down into the bottom of the range that should bring buyers to make a play. This lower support region is 2070-2074 today.
We remain trapped in a range that could press into old levels of resistance, but until we see a breach and retest of the congestion levels near 2098 with momentum, we are such to stay in this choppy mode.
The Morning Report: S&P 500 Futures Still Rangebound
Heavy congestion with neutral momentum sits between 2082 and 2087 on the S&P 500 futures chart. A breach above there and we should expand into 2094.25 again, and the charts could really open above into 2097.75. Because of momentum, any range expansions will fail and return to the edges of the range, 2070 – 2096.
The weight of motion remains on the shoulders of buyers keeping the key level of 2076.5 to hold, but sellers sit above that level near 2077.5. In these range bound spaces, it is important to watch for lower highs to signal sellers on the advance, and watch for buyers to drive higher lows as they build new support structures.
Momentum on the four hour chart is neutral, but falling. Rangebound behavior is likely, but as long as charts hold support regions noted near 2070.75, we’ll see buying strength hold through the day into resistance.
See today’s economic calendar with a rundown of releases.
THE RANGE OF THURSDAY’S MOTION
Crude Oil Futures (CL_F)
Outlook for Crude Oil on April 28, 2016 – More bullish action into resistance today. Big resistance levels showed up at 45.71, at the top of the range that I suggested. And though we have seen some reversal, buyers have shown up at support zones. If the bullish action holds, we see higher levels from 45.9 and 46.04, to 46.23.
Today, the trading ranges are 44.5 -45.9. Our slant should remain bullish, though cautiously, as we are clearly near resistance. As always, my eyes look for the lower highs in these spaces, or tests of lower support under weaker momentum to reverse my bullish slant through the day’s price action. If range expansion holds upward, we could see the test of areas near 47 before selloff action holds for a bit.
Moving averages in oil are bullish on tighter intraday time frames, and bullish to mixed on longer time frames. Support levels are near 45.13 – 44.67
Intraday long trade setup suggests a long off a 45.7 retest, or the 45.2 positive retest on the pullback (check momentum here at low level bounce, and watch the region at 45.59 for sellers) into targets of 45.3, 45.44, 45.67, 45.85, 46.04, 46.17, and if buyers hold on, we’ll see 46.54, and 46.72.
Intraday short trade setup suggests a short below a 45.1 failed retest, or the failed retest of 45.7 (with negative momentum prevailing) sends us back through targets at 45.47, 45.23, 44.81, 44.64, 44.4, 44.15, and 43.87, if sellers hang on.
E-mini S&P 500 Futures (ES_F)
Below is a S&P 500 futures chart with price support and resistance trading levels for today. Click to enlarge.
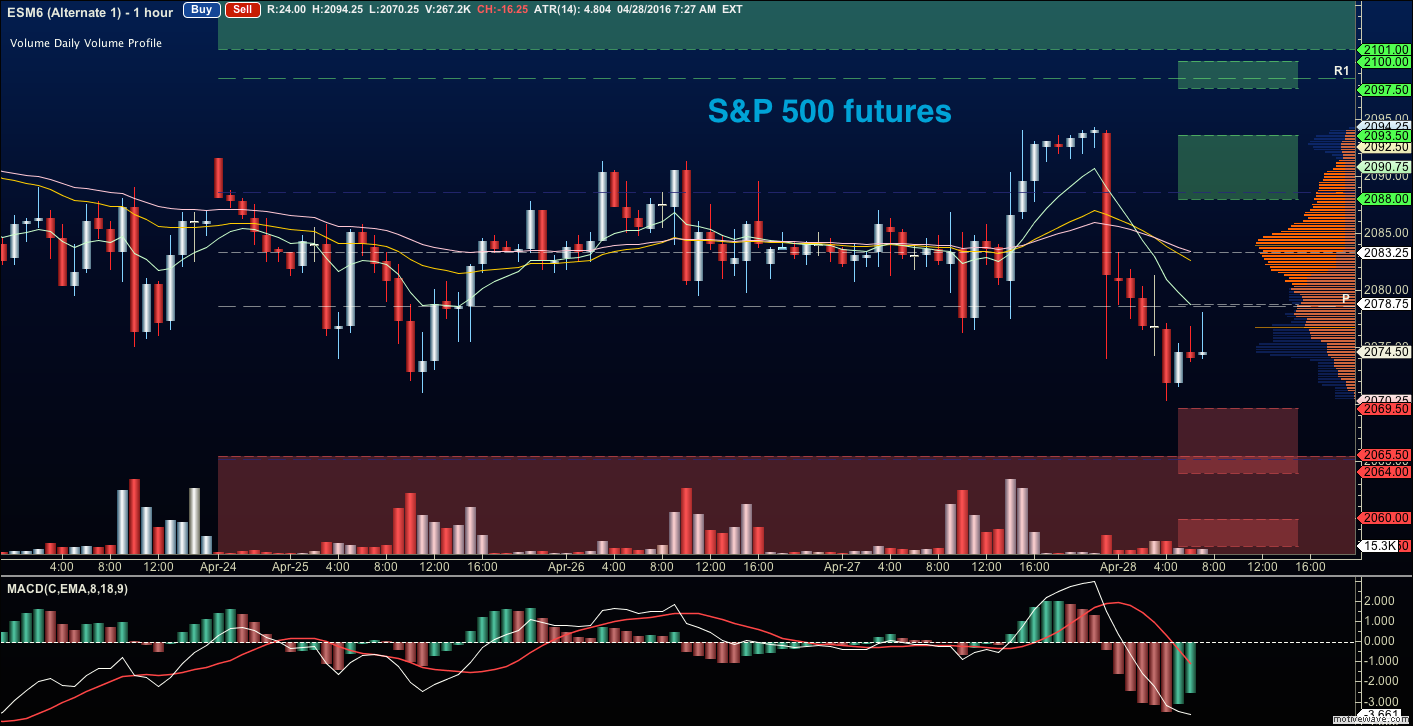
Outlook for S&P 500 futures for April 28 – The levels between 2098.75- 2104.25 still serve as important resistance, but an advance of sellers have pushed near term resistance lower into the 2092-2095 area for now. Front line support sits near 2071.5- 2074 region, and though we failed this on the BOJ news, we now are sitting above this zone. A group of sellers sit near 2077.75. They need to be watched.
Upside motion has the best setup on the positive retest of 2078.75 or a bounce off 2071.75 with positive momentum – keep your eyes on 2074.25 with this 2071.75 entry. I use the 30min to 1hr chart for the breach and retest mechanic. Targets from 2071.75 are 2074.5, 2077.75, 2082.25, 2086.5, 2089.5, and if we can catch a bid there, we could expand into 2094.5 to 2097.75. Long action is still trending over the bigger picture for now, but momentum continues to slow. We open the day with neutral to negative momentum.
Downside motion opens below the failed retest of 2075.75 or at the failed retest of 2086.25 with negative divergence. Retracement into lower levels from 2086 gives us the targets 2084.50, 2082.5, 2078, 2075.25, 2071.5, and perhaps 2069.5 to 2065.5. Buyers should still come to the rescue at the deep support, particularly at the first pass.
If you’re interested in the live trading room, it is now primarily futures content, though we do track heavily traded stocks and their likely daily trajectories as well – we begin at 9am with a morning report and likely chart movements along with trade setups for the day.
As long as the trader keeps himself aware of support and resistance levels, risk can be very adequately managed to play in either direction as bottom picking remains a behavior pattern that is developing with value buyers and speculative traders.
Twitter: @AnneMarieTrades
The author trades stock market futures every day and may have a position in mentioned securities at the time of publication. Any opinions expressed herein are solely those of the author, and do not in any way represent the views or opinions of any other person or entity.

: Worrisome to Broader Market?")


