Since our original post in late December when the S&P 500 was the Fibonacci support price level of 2375.51, the index is up nearly 22% (at the time of this write up).
Some upside gaps have been closed while some new gaps have been created to the downside.
But price can easily pull back and close those.
So where are we now?
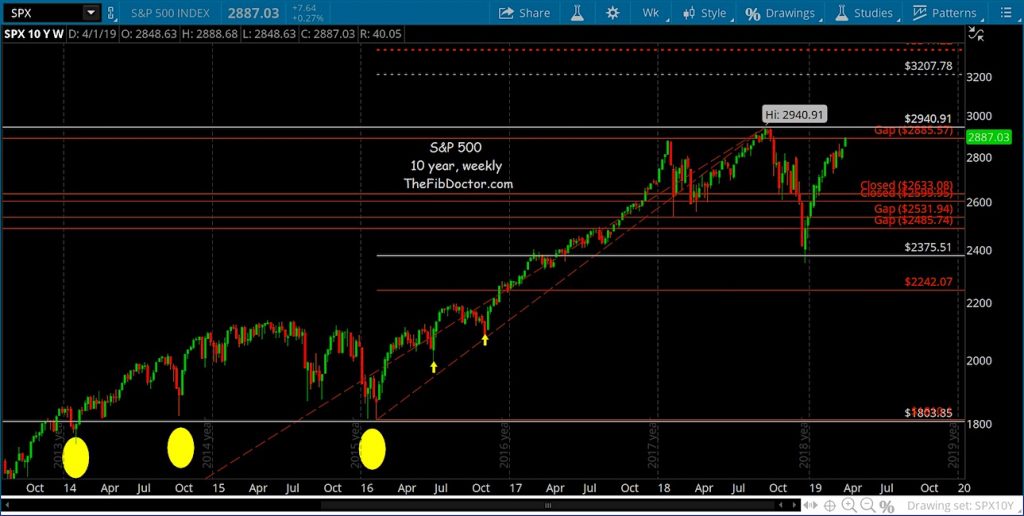
The S&P 500 is filling a gap right now at 2885.57. A close above this level and the next price resistance will be 2940.91. I think the old highs will prove to be brief and minor resistance (once we get there).
I still maintain my upside price target of 3207.78 for the S&P 500.
S&P 500 Weekly Chart
Twitter: @TheFibDoctor
The author may have positions in mentioned securities at the time of publication. Any opinions expressed herein are solely those of the author, and do not in any way represent the views or opinions of any other person or entity.


 and Semiconductors (SMH): Concerning Price Pattern?")


