S&P 500 Index – Intermediate Term Outlook
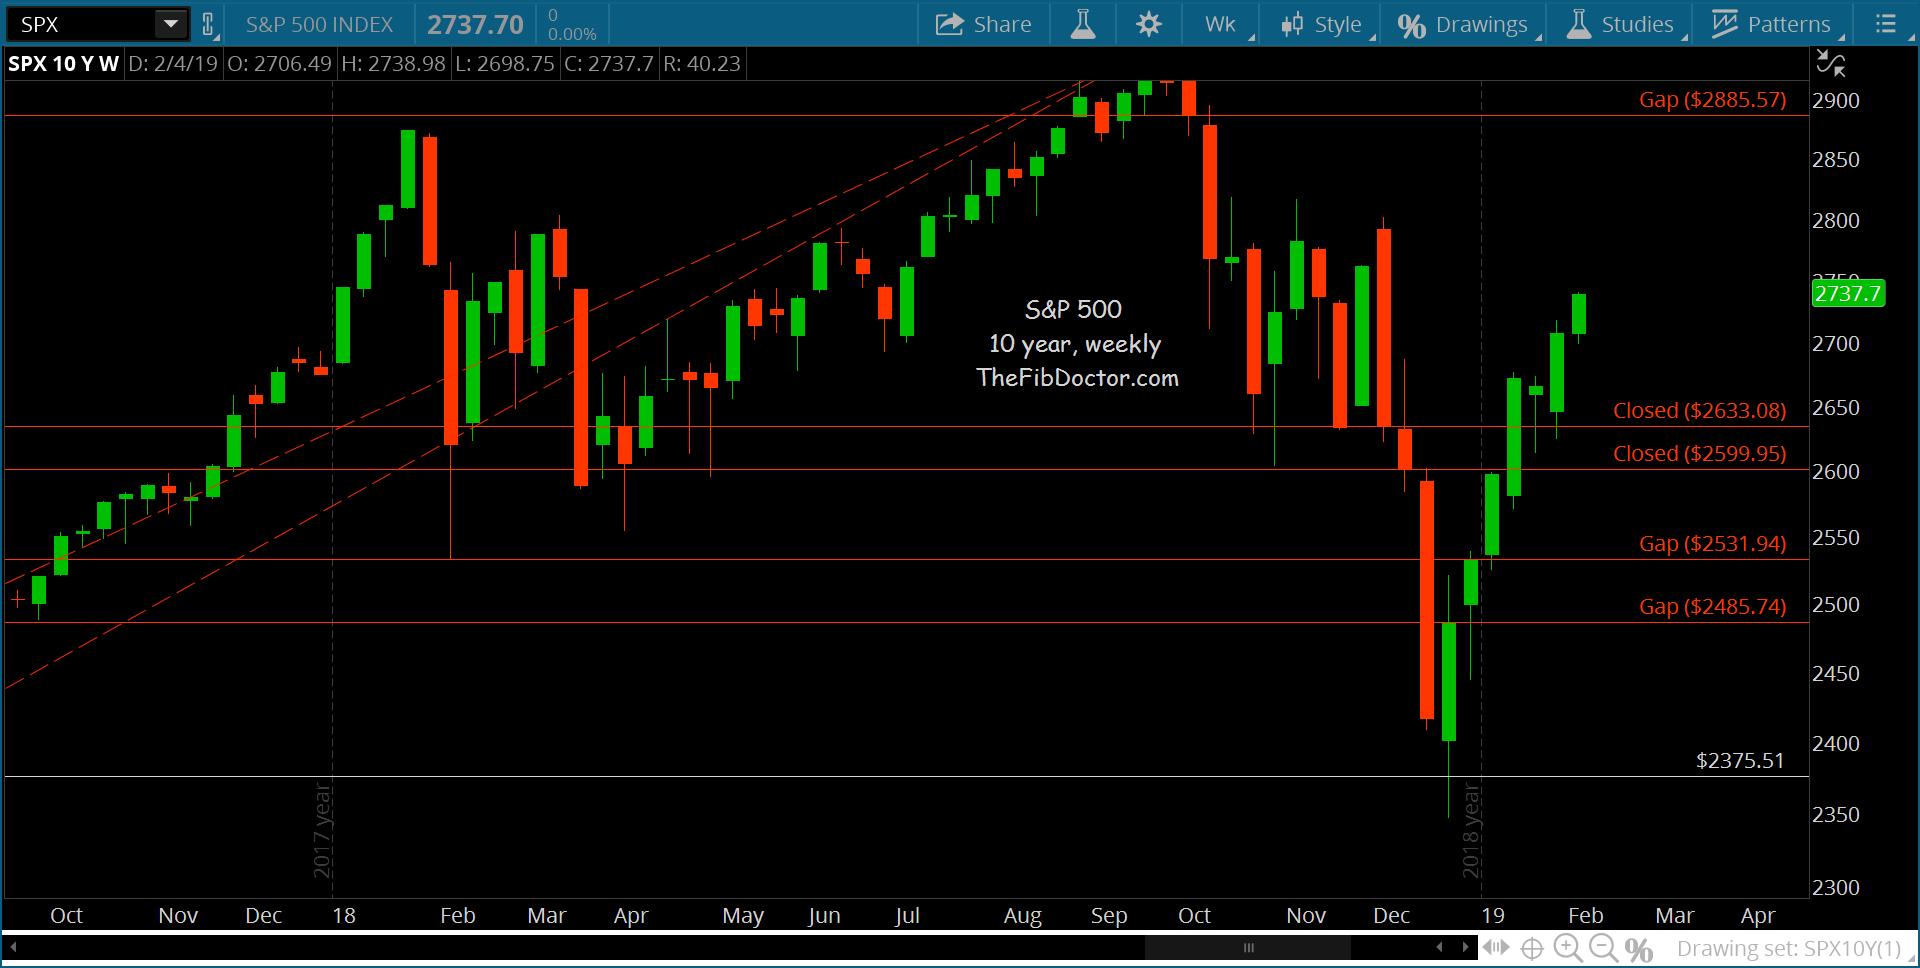
The S&P 500 Index has left a few open gaps below the current price. The broad market index can pull back at any time to close these open gaps.
That said, price has closed 2 gaps at 2599.95 & 2633.08, which are now support levels.
Watch for resistance in the range of 2800.18 – 2816.94, albeit temporary.
The next overhead gap at 2885.57 should offer a bit stronger resistance. Closing above this level will open the door to 2940.91, the high of 2018.
Using my Fibonacci method, I have 2375.51 as a major support level, which has been holding. As long as this holds, we should eventually see a breakout targeting 3207.78.
Upside breakout target = 3207.78
Note that this is a longer-term target and not for shorter term players.
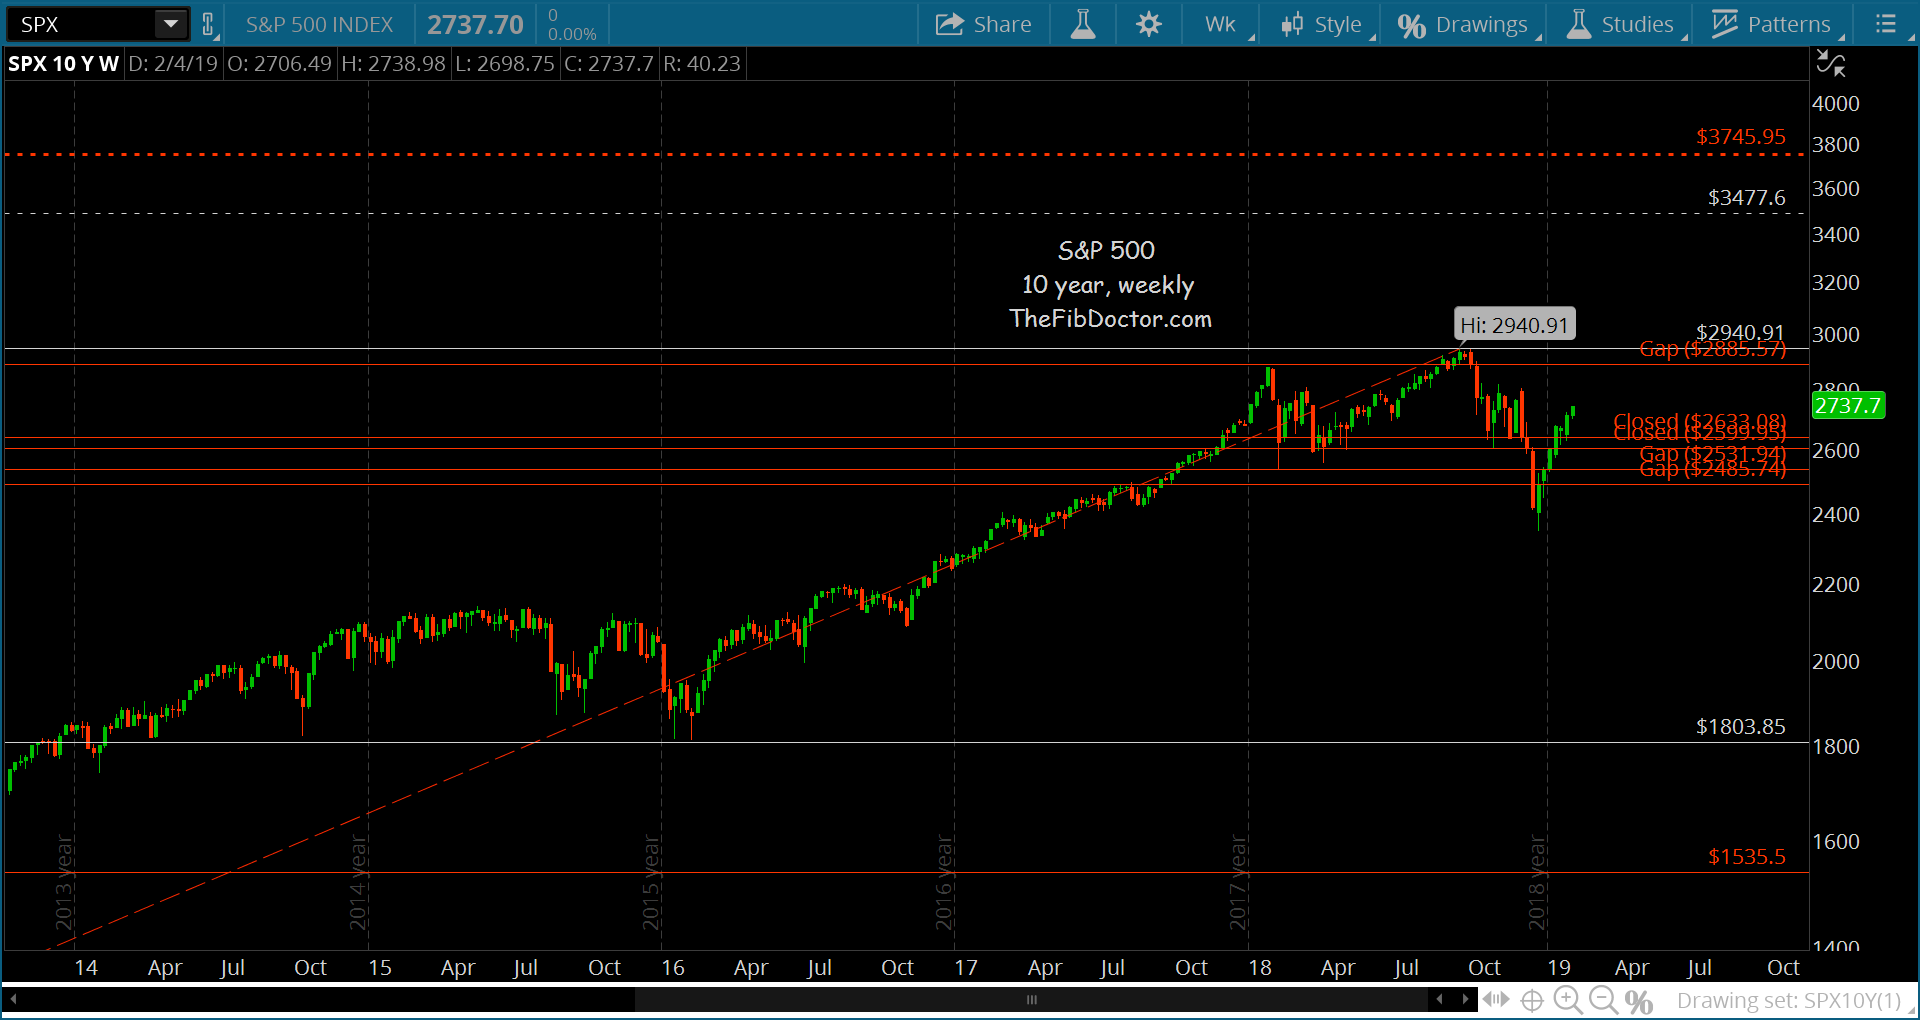
S&P 500 Index – Longer Term Outlook
A Longer term target = 3477.6
2 major support levels way down at 1803.85 & 1535.5.
A move above 2940.91 opens the door to our initial breakout target (3207.78) and then 3477.6.
Keep in mind, these are LONG term levels and not for shorter term players.
Twitter: @TheFibDoctor
The author may have positions in mentioned securities at the time of publication. Any opinions expressed herein are solely those of the author, and do not in any way represent the views or opinions of any other person or entity.


