I would think the most asked questions by traders in 4Q18 is “Where is support?”
Using a 10 year chart of the S&P 500, I’m going to give you my best answer(s).
We will progress through a series of 3 charts. Note that they were put together yesterday (Thursday).
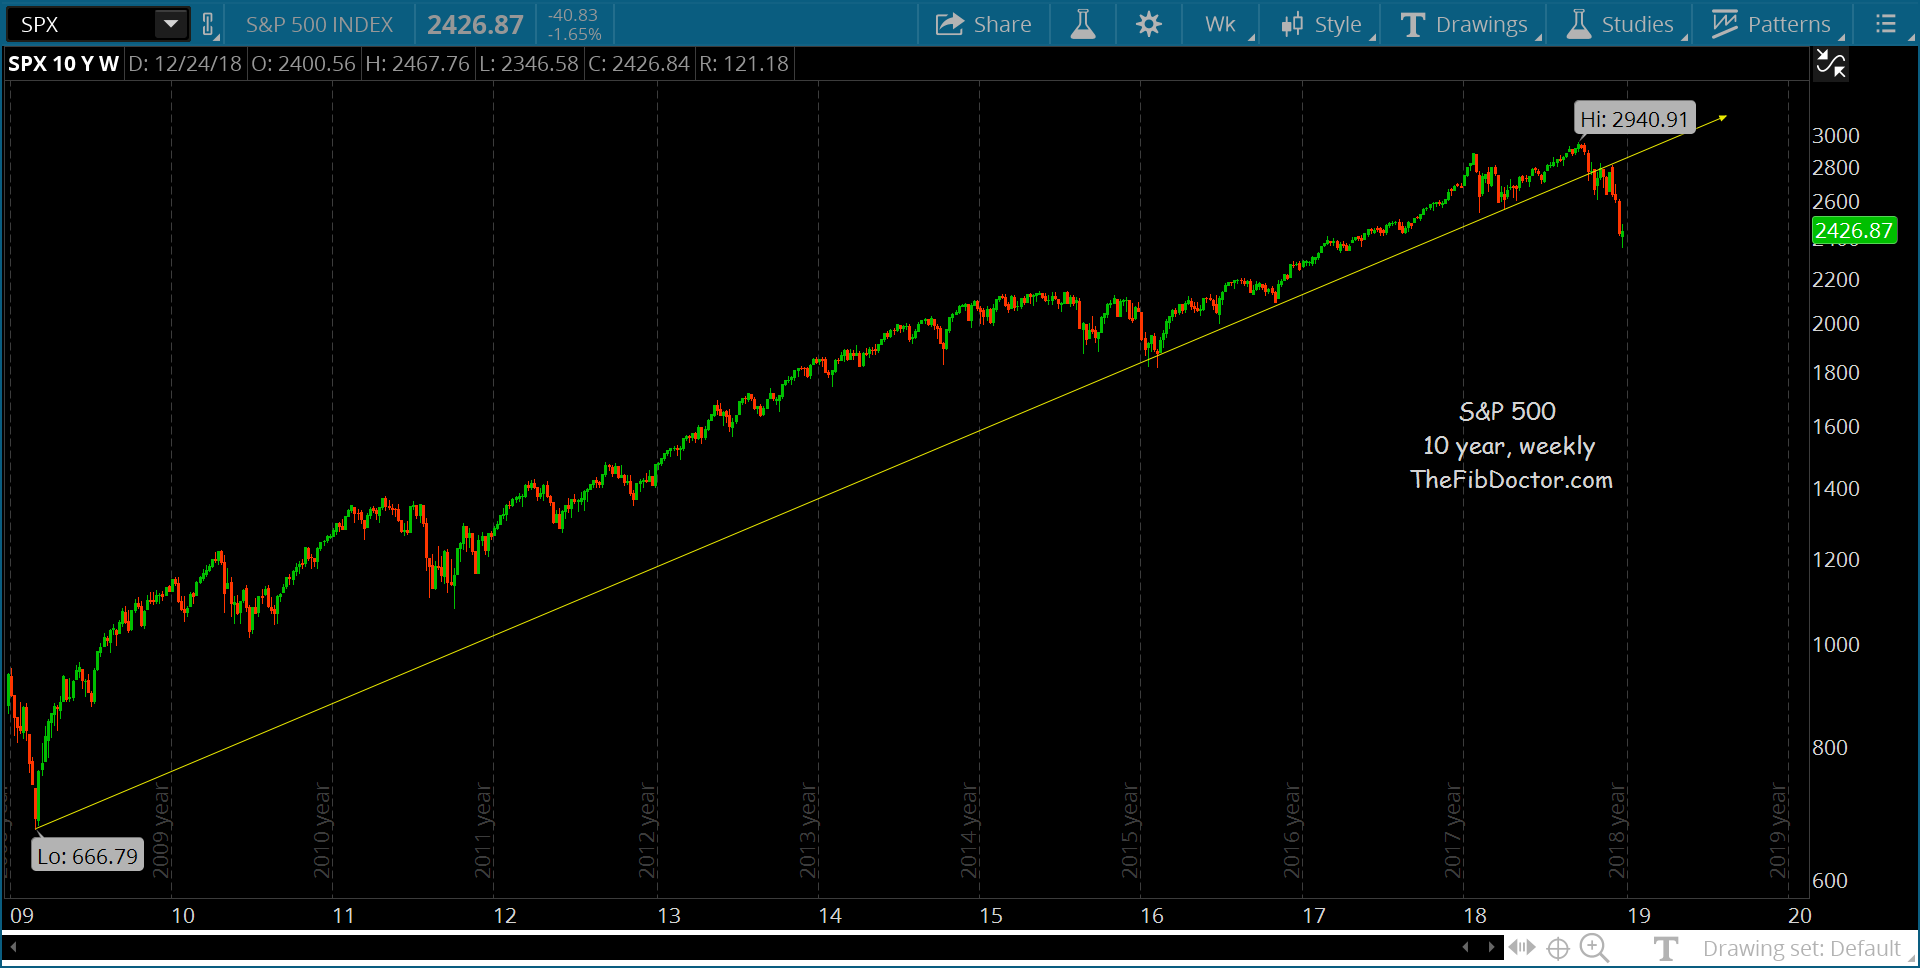
Let’s start the most basic of technical analysis tools: A simple trend line. In the chart below, you’ll see that the market has been a raging bull market for nearly 10 years.
BUT that trend line has now been broken.
So now, let’s walk through my Fibonacci method to determine likely areas of price support.
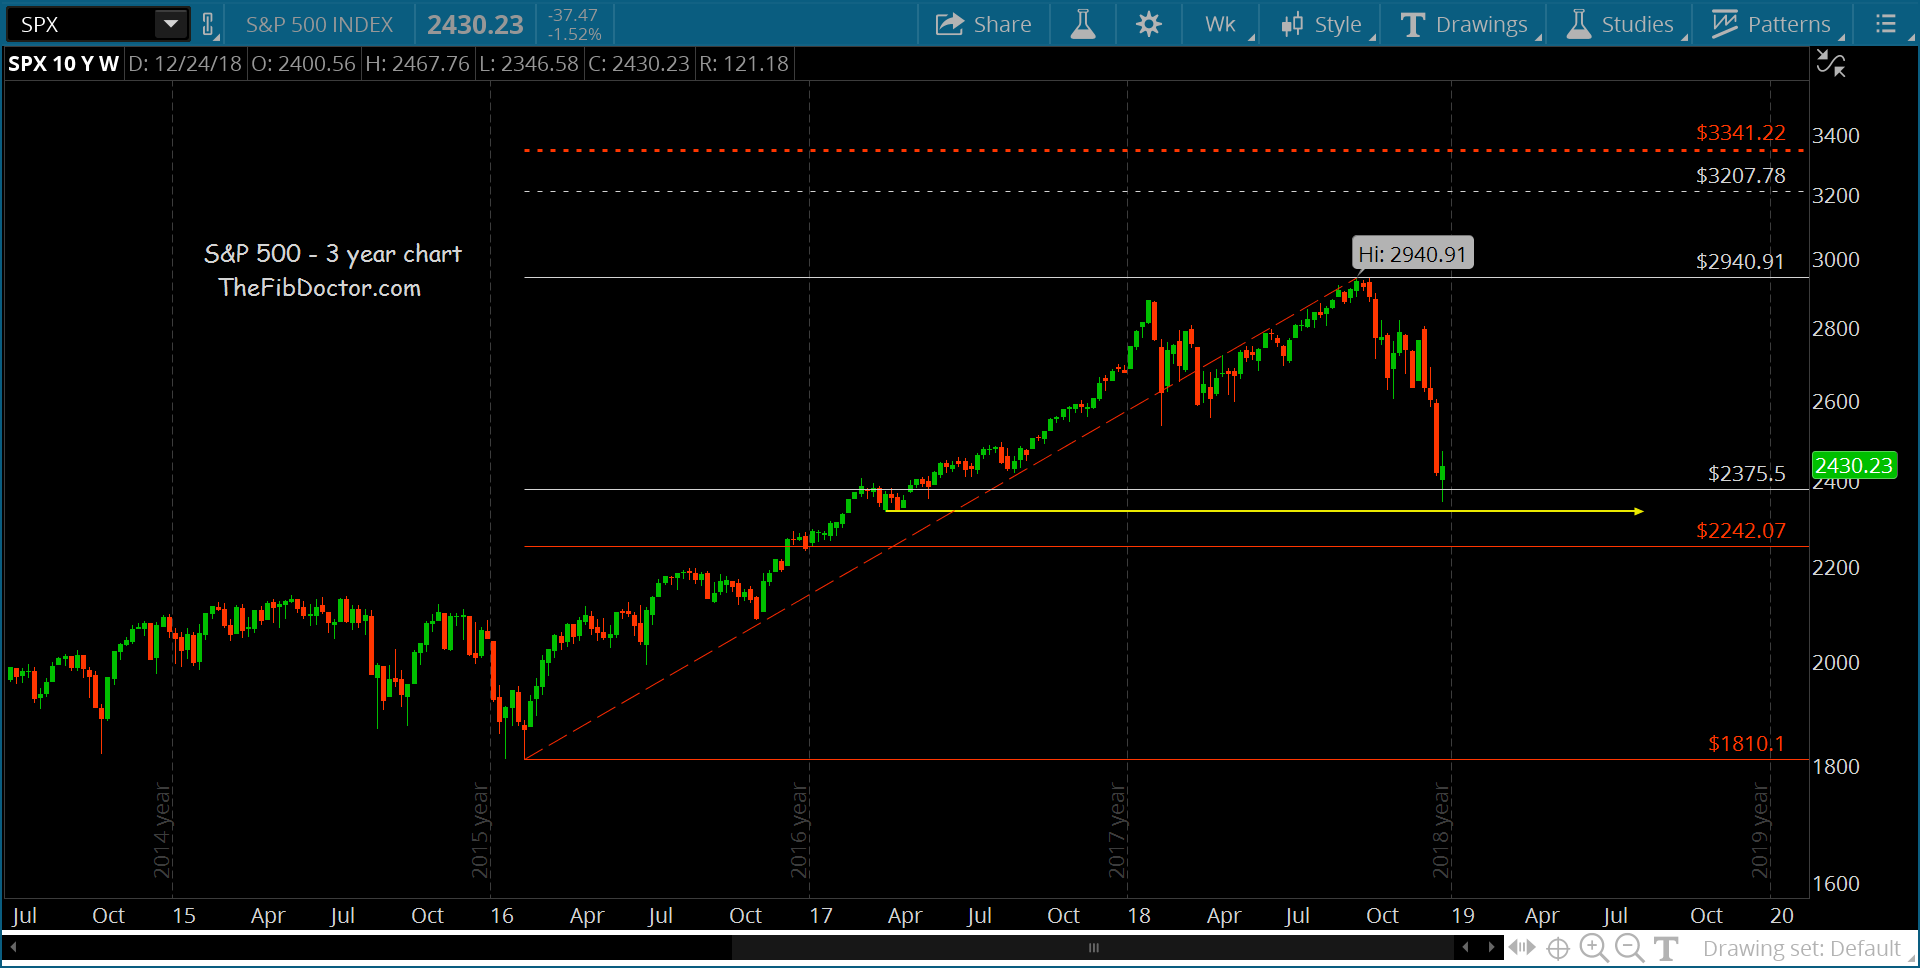
Using my Fibonacci method, and going back 3 years, you can see in the following chart that we actually tested a key lateral support area intraday while briefly undercutting Fib support level at 2375.5.
Should that level fail, there is a secondary support level 133 points lower at 2242.25.
In the early part of 2017, there was support in the 2322 – 2328 area (highlighted on chart). That area is worth noting because it falls between the 2 Fibonacci support levels. I think this is a very important price area to watch.
ZOOMING OUT
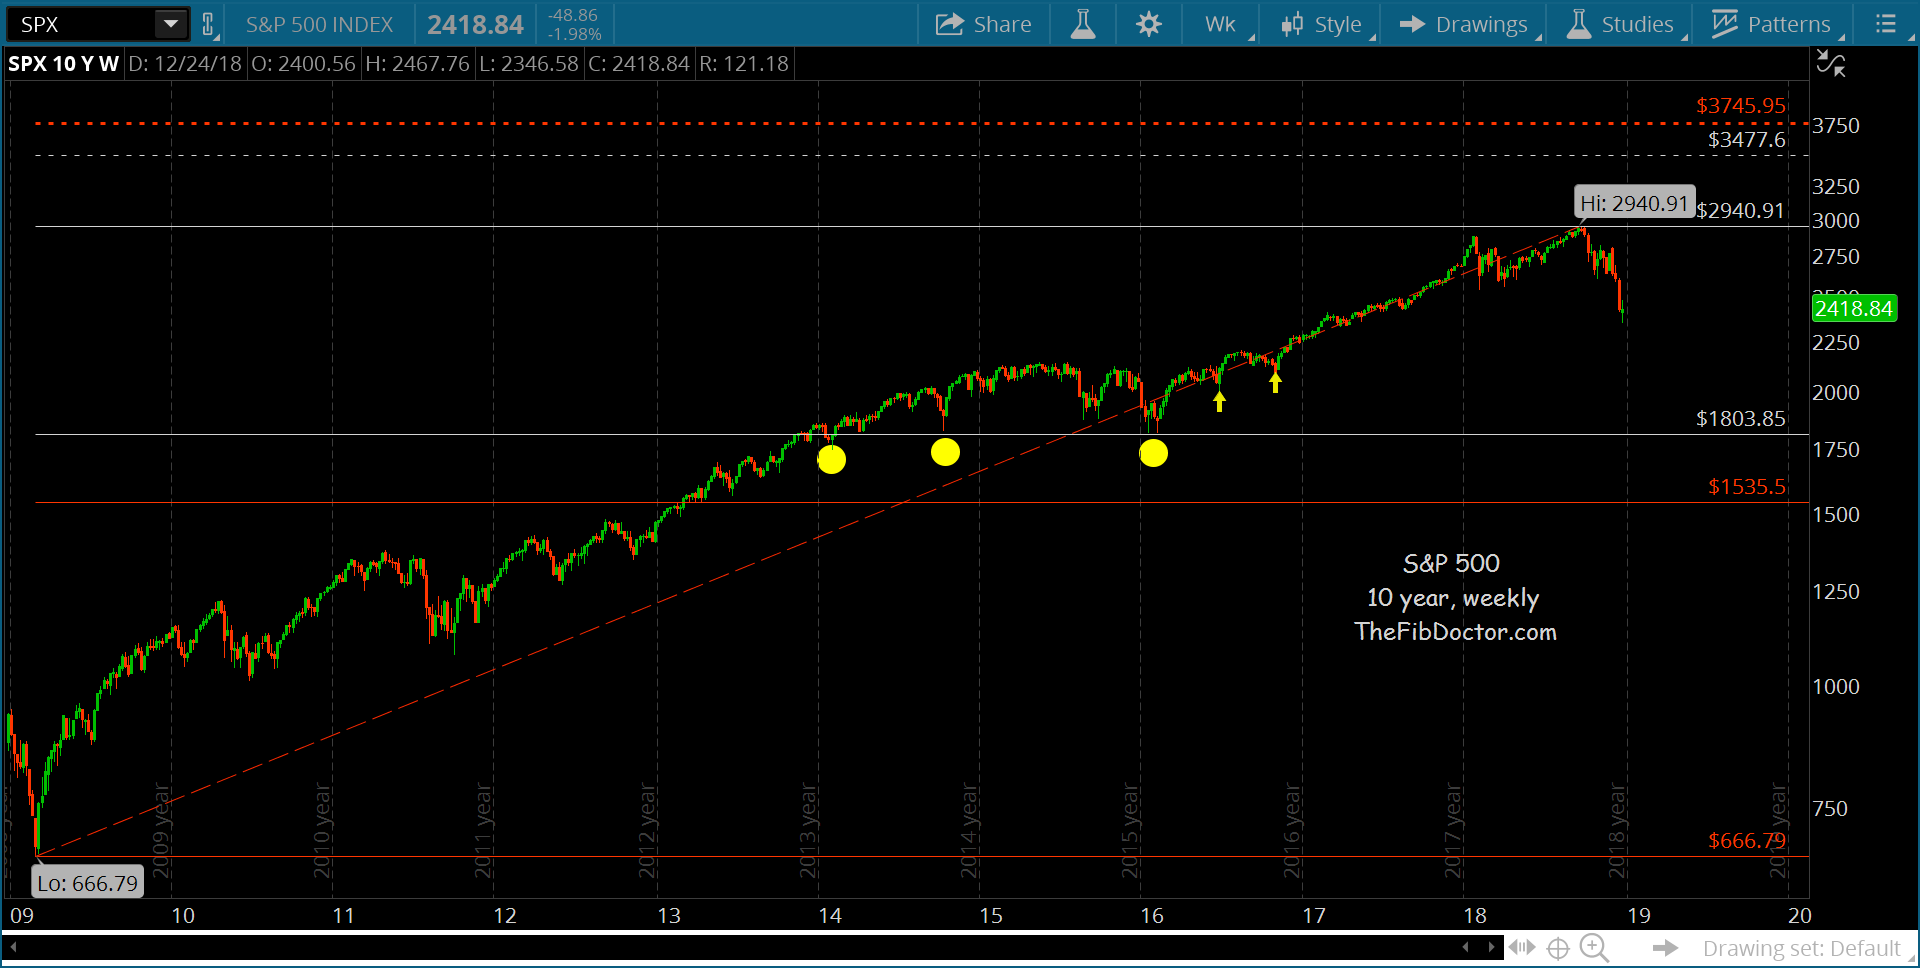
Looking at the entire bull market run (to date), from my Fibonacci method perspective, there is a support level at 1804. What makes this level interesting is that support has been found there 3 times previously (highlighted on chart below). Below there, I don’t see any support until 1535.
These are extreme levels, so watch these if we break the more immediate levels of concern.
I’ve also highlighted 2 areas of minor support where you’d likely see a bounce in the 1992 – 2084 zone.
There’s no need to try and “call the bottom,” just watch these price levels of support and be PATIENT!
Twitter: @TheFibDoctor
No position in any of the mentioned securities at the time of publication. Any opinions expressed herein are solely those of the author, and do not in any way represent the views or opinions of any other person or entity.


 and Semiconductors (SMH): Concerning Price Pattern?")


