The new highs in recent weeks among the U.S. stock indices may have disappointed the few remaining stock market bears, but now is when equity bulls should be cautious. Today’s post revisits our Elliott wave analysis of the SPDR S&P 500 ETF Trust (NYSEARCA: SPY), which we wrote about in mid-July.
After the scary March low, price climbed rapidly to surpass our expected resistance areas at 323 and 329. However we continue to watch the channel that has guided the S&P 500 ETF (SPY) through 2019 and the first half of 2020.
Price has now extended as far beyond the upper boundary as it extended beneath the lower boundary in March, suggesting that a “return to mean” is probably due.
While we are fairly confident in labeling the down-up-down action of 2019 and early 2020 as a fourth wave, the form of the rally since March is more ambiguous. It doesn’t have the overlapping Elliott wave qualities of a typical corrective pattern, but it also does not count well as an impulsive (five-wave) pattern. Despite the lack of overlap, a corrective count looks better on a daily time frame (not shown here).
The strong yet not impulsive form of the 2020 rally sometimes characterizes the waves inside an ending diagonal pattern. (We encourage you to read this brief tutorial about ending diagonals.)
New highs for the S&P 500, but bulls shouldn’t get cocky
If correct, the implication has the S&P 500 (and ETF ticker SPY) moving generally upward with advances and retreats during the next one to two years, reaching for a significant top (per Elliott wave) perhaps sometime in 2022.
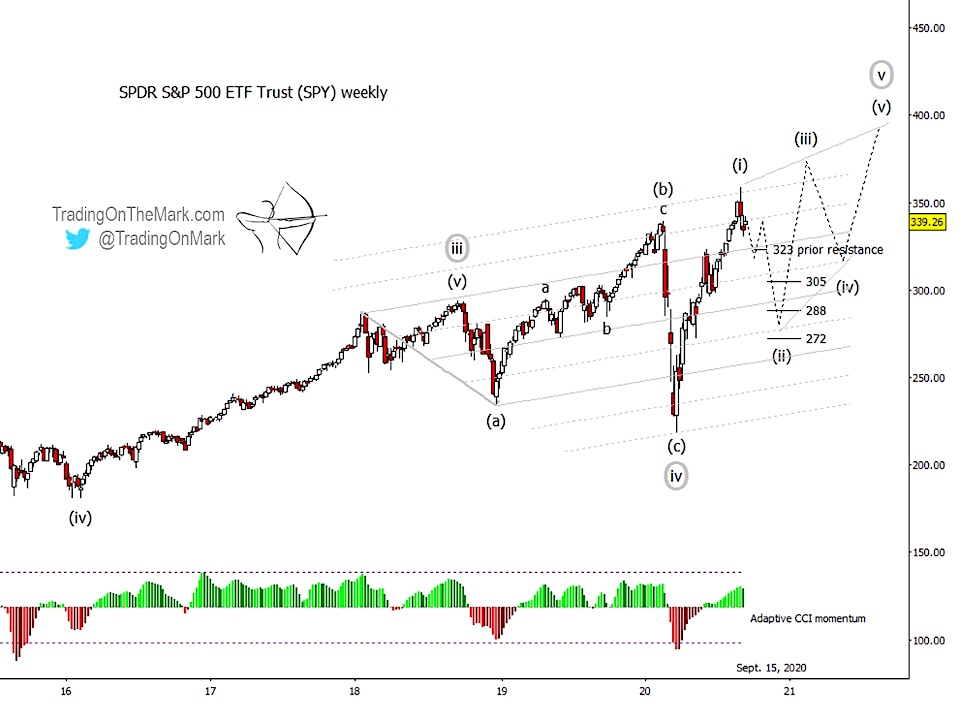
While it is not yet certain that upward wave (i) is complete, the decline during the past two weeks should encourage near-term bearish traders. A break and weekly close beneath prior resistance and the channel boundary near 323 would serve as confirmation that we are seeing downward wave (ii) of the diagonal.
We have marked some preliminary estimates of support for (ii) at 305, 288, and 272, and we should be able to refine those estimates as price action develops.
Visit our website for more charts, and follow Trading On The Mark for updates and special offers.
Twitter: @TradingOnMark
The authors may have a position in the mentioned securities at the time of publication. Any opinions expressed herein are solely those of the author, and do not in any way represent the views or opinions of any other person or entity.


