Here we revisit the SPDR S&P 500 ETF Trust NYSEARCA: SPY with some newly refined downward price targets.
We believe price might try to form a low in late summer or autumn of this year as the stock market pulls back.
Our main Elliott wave scenario is still quite bullish during the next one or two years, but as we mentioned in our June 9 post the S&P 500 ETF (SPY) appears overdue for a correction in the near term.
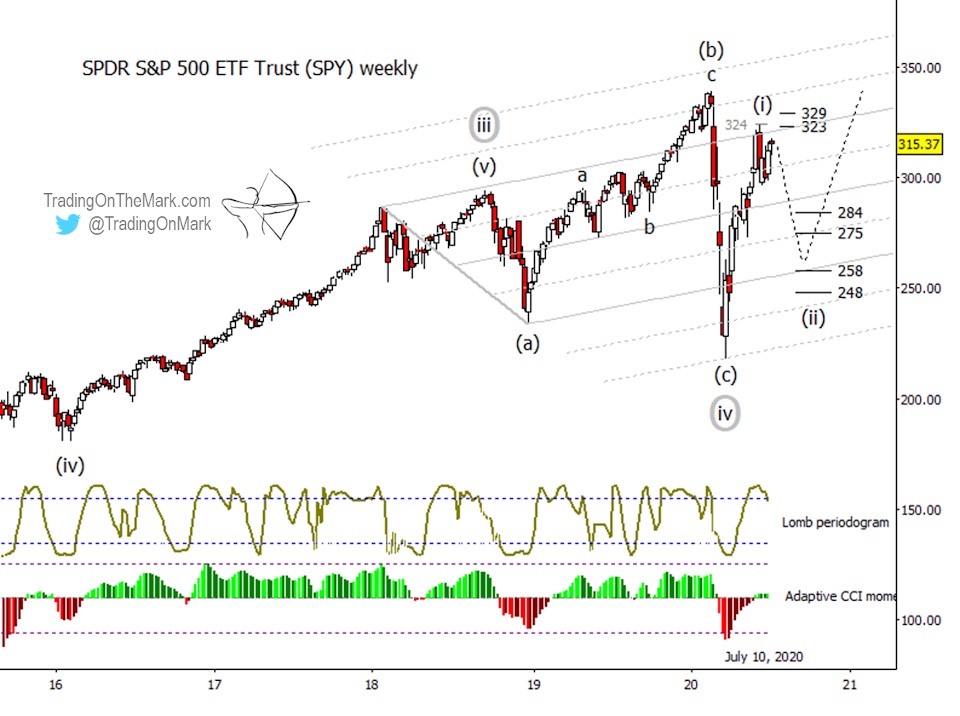
The spring rally stopped at the highest price resistance level we showed on our previous chart at 324.
Subsequent price action has the look of a lower high, which may represent the first parts of the correction.
In addition to our wave count on a daily chart (not shown here), the notion of the rally from March being complete is also supported by the high position of the Lomb periodogram – our preferred fast-response tool for identifying price/time cycles. On a weekly chart the indicator appears poised to drop, suggesting that price should drop with it.
Note that the adaptive CCI momentum indicator also appears stalled near its zero line. This favors the idea that the decline can resume soon.
With a lower high now possibly in place, we are able to refine our targets for the remainder of the correction. Supports at 284, 275, 258 and 248 are based on confluences of Fibonacci retracement and extension values. Of the four supports, the one at 258 looks most attractive, as it could coincide with the lower boundary of an improvised channel that has been working for more than a year.
As a minor alternate contingency, price could push up slightly in the very near term to test the areas near 323 or 329, to make a somewhat higher ‘b’ wave of the correction. (The internal waves of the correction are not labeled on the weekly chart shown here.) Even in that case we would still expect a strong downward move in wave ‘c’ of (ii) fairly soon.
Visit our website for more charts, and follow Trading On The Mark for updates and special offers.
Twitter: @TradingOnMark
The authors may have a position in the mentioned securities at the time of publication. Any opinions expressed herein are solely those of the author, and do not in any way represent the views or opinions of any other person or entity.


