The major U.S. stock indices continue to rally, and many of them show what appear to be impulsive formations out of the scary spring lows.
We described this development in our bullish forecasts of March 6 and May 5, but we were surprised by the energetic way some of the indices jumped over resistance last week.
This article examines the SPDR S&P 500 ETF Trust NYSEARCA: SPY now that it has broken above a level we were watching.
We still believe a stock market correction is due that should last for several weeks or months, but that forecast requires confirmation.
Readers will recall that we are treating the price action in most of the indices from late 2018 into early 2020 as large fourth-wave corrections.
In that scenario, we would expect some type of motive pattern to emerge on the S&P 500 ETF (SPY) and eventually take prices to new highs in wave [v]. The first leg (i) of the motive pattern should be an Elliott wave impulse, or five-wave structure.
The rally since the March 23 low has been quite steep, but there may be a complete five-wave structure on a daily chart (not shown here). That scenario would label the rise from March as wave (i) of [v].
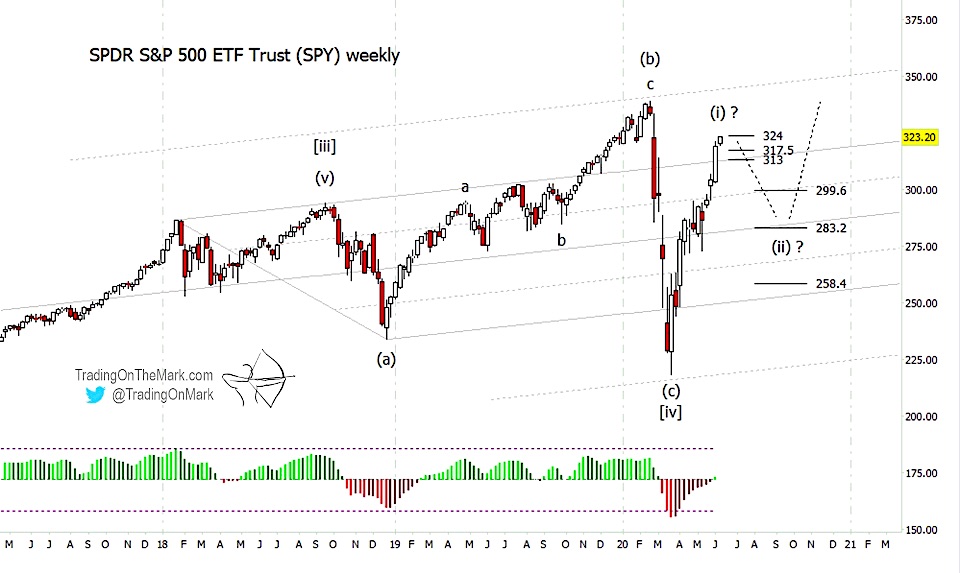
The next best alternative would be treating the rise as a nested set of impulse waves, counted as (i)-(ii)-i-ii-iii, that could shoot considerably higher in the near term.
Confirmation of our primary scenario would come with a failure of resistance-turned support at 317.50 and better at 313. That would put price back in the channel that has guided most of the action since 2018, and it would allow for a modest retrace or sideways move during the rest of the summer.
Fibonacci targets for a retrace include 299.60, 283.20, and 258.40. The middle one looks most attractive.
On the other hand, a break of the 324 area as resistance would strengthen bullish prospects in the near term, as it could prolong the “fear of missing out” rally.
Note that the adaptive CCI momentum indicator is just now testing its zero line – an event that often coincides with a reversal of some magnitude.
Visit our website for more charts, and follow Trading On The Mark for updates and special offers.
Twitter: @TradingOnMark
The authors may have a position in the mentioned securities at the time of publication. Any opinions expressed herein are solely those of the author, and do not in any way represent the views or opinions of any other person or entity.

 Testing Important Price Support")
: Cup (and Maybe Handle) Watch")

