We’ve been using our ongoing series of posts about the Russell 2000 Index INDEXRUSSELL: RUT and the associated ETF to show how Elliott wave analysis can change and adapt over time while still providing useful trading signals.
Check out those posts right here.
Developments since our last post are now causing us to revise our wave count and our understanding of the developing pattern.
Being forced to revise our pattern analysis is in no way a setback.
In fact, it’s one of the Elliott wave trader’s greatest advantages to be able to recognize quickly when a forecasted pattern isn’t playing out as it should. In many cases the trader is able to identify the next scenario the market should try to manifest, along with price levels that can produce tradable reactions.
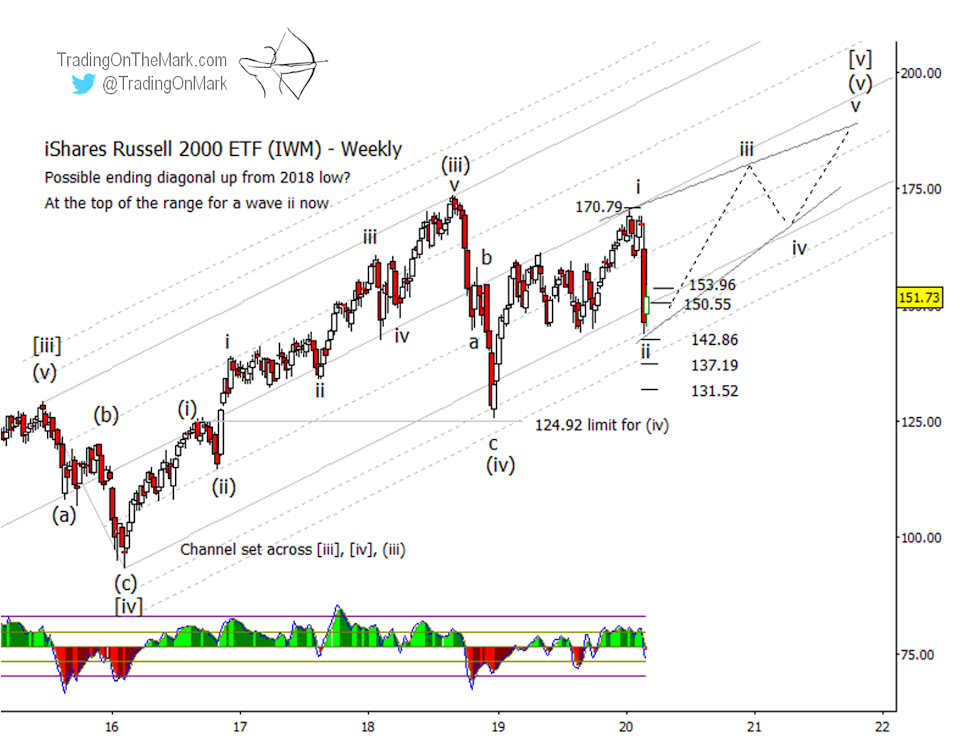
In last week’s article about the iShares Russell 2000 ETF NYSEARCA: IWM, we noted that price was falling as expected from resistance at 170.79, and we suggested that price might test levels as low as 152.11 in the near future.
We were projecting the decline in the context of downward wave ‘iv’ of an ending diagonal pattern. (See this page for an explanation of ending diagonals and how they behave.)
Last week price dropped considerably lower than the lowest support in our scenario. The fact that it was able to re-test the price area of the previous low has caused us to classify the decline as something other than a wave ‘iv’.
However many of the same considerations that originally led us to deduce the formation of an ending diagonal are still in effect, and they still matter with regard to the next proposed scenario. Specifically:
- The climb from the December 2018 low to the January 2020 high unambiguously consisted of three waves.
- The decline from the January 2020 high still appears to consist of three waves, although it is not yet certain the decline is finished.
For an Elliottician, each of those two considerations mentioned above the chart has implications for where the pattern may go next. We’ll describe the possibilities briefly before explaining why we now favor the larger ending diagonal pattern that’s drawn here on the weekly chart.
The three-wave nature of the climb from December 2018 to January 2020 suggests that the entire span should be viewed as either:
- the first segment of a diagonal pattern (similar to what we believed was operative last week, but larger),
- or a corrective element in the context of a large wave (iv).
- In the latter case, if the rise was part of an ongoing fourth wave, it could be either the middle part ”b’ of a large three-wave correction, with price now trying to move down in wave ‘c’,
- or it could be the second segment ‘b’ of a contracting triangle.
The structure of the decline from January 2020 provisionally consists of three waves.
- If it finds support nearby, while retaining its three-wave structure, then the decline could represent wave ‘ii’ of a diagonal pattern, as drawn on the chart. This is currently our favored scenario.
- On the other hand, if IWM makes a moderate bounce followed by a lower low, the decline might be viewed as having a five-wave structure. In that case the decline would be best viewed as a wave ‘c’ of (iv), and it would increase our expectation for the number of rallies the market can still produce before it reaches a real top.
- In order for the decline to be a complete sub-wave in a contracting triangular wave (iv), it would ideally reach lower than it already has done while still retaining its three-wave structure.
With that array of pattern scenarios in mind, we also know there are Fibonacci-related supports that IWM is likely to recognize. Price is currently attempting a bounce from just above the support at 143.91. If it follows through with a substantial rally, it will lend credence to the idea that price is now rising in wave ‘iii’ of a diagonal pattern.
Bullish traders might note that at last week’s frightening close there was an extremely strong positive momentum divergence according to the adaptive CCI indicator shown on the chart. Confirmation of a developing upward wave ‘iii’ would come with a breach of 150.55 and (better) 153.96.
If we don’t see a rally, and instead the first support fails, then IWM is likely to test next supports near 137.19 and possibly 131.52. Finding a floor at either of those areas would preserve the idea of an ending diagonal pattern as long as the decline into support retains its three-wave structure. However a test of those levels could also make the triangle scenario viable.
Finally, the “support of last resort” for all the scenarios described here sits at 124.92. A weekly close beneath that level would invalidate the ideas of a diagonal pattern and also any type of fourth wave. A failure of that level would produce a very strong negative reaction. (We believe such a failure is unlikely at this time, but it’s important to know where our current bullish forecast would be invalidated.)
As a weekly exercise, we’ll continue monitoring IWM’s twists and turns, and we’ll keep comparing real price action to our Elliott wave model. We’ll highlight aspects of the forecasts that worked well, and we’ll announce when pattern expectations might need to be revised. We encourage readers to post questions and comments about the technical analysis as our series of posts progresses.
Trading On The Mark provides detailed, nuanced analysis for a wide range of markets. With a Daily Analysis subscription, you get twice-daily updates for heavily traded markets including the Euro, gold, crude oil, bonds and the S&P 500. The Intraday Analysis subscription offers additional moment-by-moment coverage.
Twitter: @TradingOnMark
The authors may have a position in the mentioned securities at the time of publication. Any opinions expressed herein are solely those of the author, and do not in any way represent the views or opinions of any other person or entity.


