It’s reasonable to blame coronavirus COVID-2019 for the recent downward move in the stock market
That said, it is also interesting to watch financial markets respond to current events while simultaneously recognizing the parameters of the Elliott wave patterns are operative at the time. Case in point, the small cap stocks index, Russell 2000.
Last week’s chart of the iShares Russell 2000 ETF NYSEARCA: IWM showed important resistance at 170.79 that had already been tested once, and we indicated our expectations that the level should produce a sizable downward retracement.
As of this writing, the Russell 2000 ETF is down more than 5 points (3%) from last Friday’s close and looking lower.
We expected IWM’s downward turn because we believe this year’s moves are taking place in the context of an ending diagonal pattern for the fund and the underlying Russell 2000 Index INDEXRUSSELL: RUT
As such, the rise from August 2019 appeared to have completed the required three-wave move that would characterize the middle wave ‘iii’ of the diagonal. (Visit this link for a quick tutorial describing where ending diagonals can occur and how they behave.)
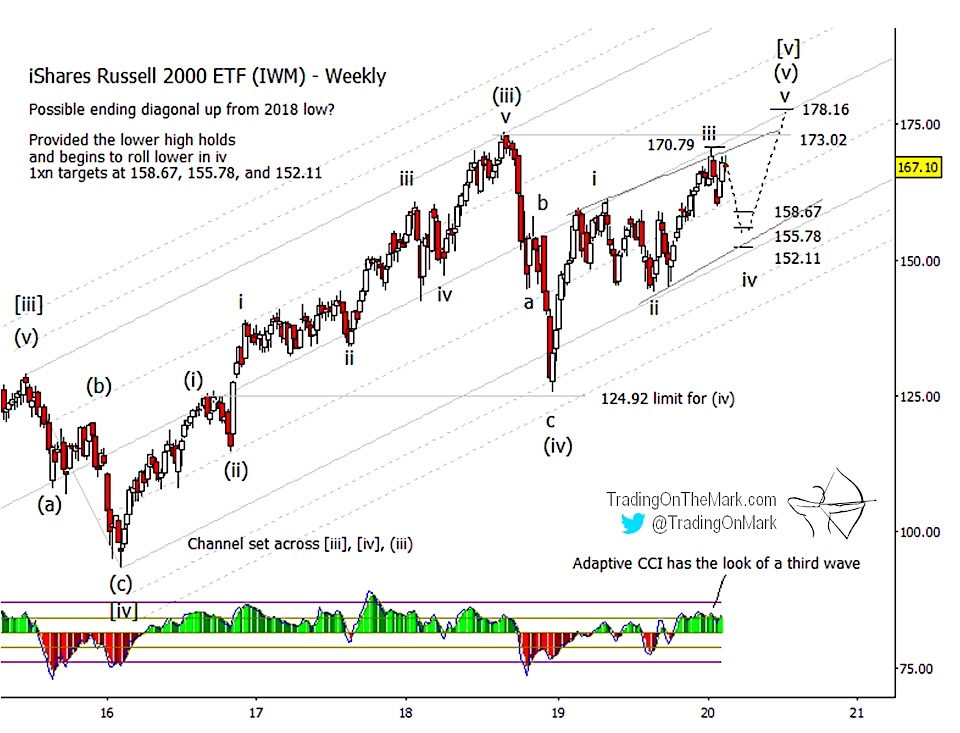
Looking forward, we have updated the price support levels that traders should watch next if the expected downward wave ‘iv’ appears on the Russell 2000 Index. It’s possible that the first two sub-waves of downward wave ‘iv’ have already printed, in which case we would expect to see the next downward sub-wave form five even smaller sub-sub-waves as it reaches toward the support area.
Of the supports we have drawn at 158.67, 155.78 and 152.11, a test of the highest one would be enough to meet the formal requirements for wave ‘iv’. Price only needs to reach beneath the peak of wave ‘i’ for the ending diagonal pattern to be valid. However we believe it is more likely that one or both of the lower supports will be tested before a serious bounce comes into play.
As a weekly exercise, we’ll continue monitoring IWM’s twists and turns, and we’ll keep comparing real price action to our Elliott wave model. We’ll highlight aspects of the forecasts that worked well, and we’ll announce when pattern expectations might need to be revised. We encourage readers to post questions and comments about the technical analysis as our series of posts progresses.
For now, the ending diagonal pattern still appears to be working very well.
Elliott wave analysis is particularly good at identifying the places to watch for turns and entry/exit opportunities. With a Daily Analysis subscription, you get twice-daily updates for heavily traded markets including the Euro, gold, crude oil, bonds and the S&P 500. The Intraday Analysis subscription offers additional moment-by-moment coverage. Learn more at Trading On The Mark.
Twitter: @TradingOnMark
The authors may have a position in the mentioned securities at the time of publication. Any opinions expressed herein are solely those of the author, and do not in any way represent the views or opinions of any other person or entity.


