The Russell 2000 Index (INDEXRUSSELL: RUT) appears to be following the main Elliott wave scenario we described in our November post, and it has slightly exceeded our upward targets.
Now there may be an opportunity for a substantial downward retracement.
Charting the index via the iShares Russell 2000 ETF (NYSEARCA: IWM), we wrote on November 22 that the fund should have substantial room to run upward going into 2020. We showed an expected near-term upward target area near 165.24 and 166.90.
In subsequent weeks, price rose fairly rapidly to meet and slightly exceed the target before stumbling.
The run up from late last year appears to have a three-wave structure starting where we have placed the label for wave ‘ii’ on the chart. Likewise, the climb out of the frightening wave (iv) low at the end of 2018 to the high we have labeled as wave ‘i’ includes three waves.
The sequence of three-wave moves suggests that the entire move up from the late-2018 low could be either a large correction or the first three segments of a rising diagonal pattern.
Meanwhile, several of the other major stock indices we track are working their ways through upward impulsive patterns and reaching new highs, and our bigger-picture analysis suggests those may become terminal highs. The disparity between the other indices and the Russell 2000 leads us to believe the current pattern in IWM is an ending diagonal, which is also a terminal pattern.
With the Russell/IWM and the other indices, we are now looking for substantial (but not catastrophic) retracements. Given the context of an ending diagonal, the downward move may be relatively larger for IWM than for the others, and nimble traders may even look for ways to take short positions until price approaches major supports.
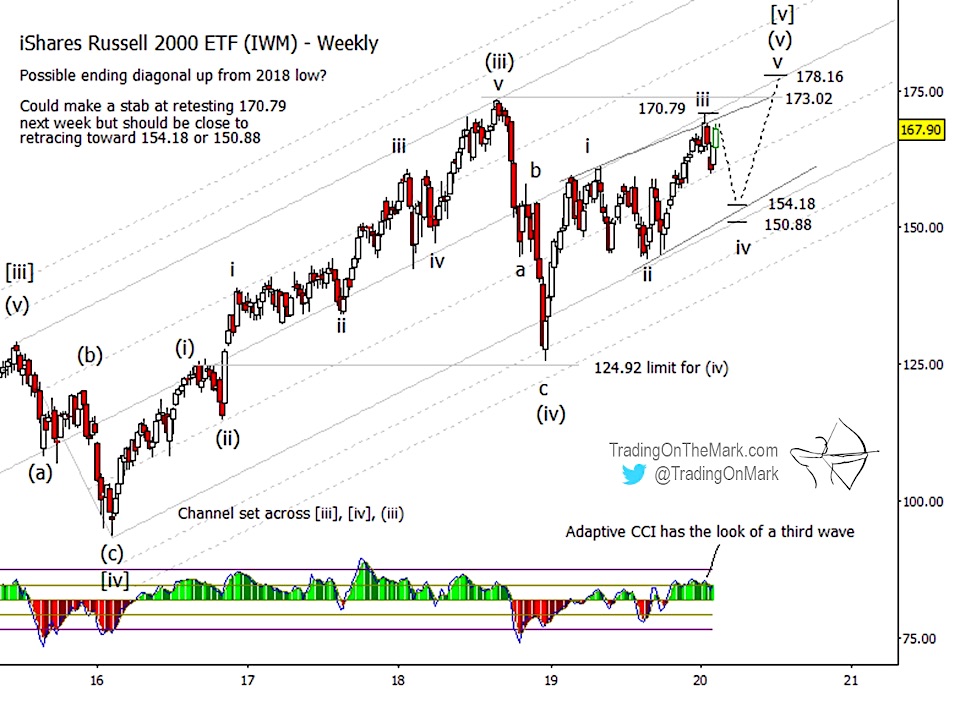
The boundaries for the diagonal pattern that we have drawn on the chart are merely approximate. The line connecting the two highs early in 2019 also worked well to catch the weekly close of the more recent wave ‘iii’ high, but we cannot be certain the same phenomenon will occur with the expected wave ‘iv’ low. We have more confidence in the calculated supports at 154.18 and 150.88, and there may also be channel support near the lower of those values.
It’s also important to note that a downward wave ‘iv’ in the diagonal really only needs to reach beneath the hight that was marked as wave ‘i’. A mere retest of the January 2020 low would be sufficient to meet formal requirements for the pattern.
An eventual fifth wave of the diagonal pattern should bring price to test or exceed the 2018 high labeled as wave (iii). Preliminary targets sit at 173.02 and 178.16 based on a confluence of Fibonacci expansion calculations. We will be able to offer a more refined projection after the wave ‘iv’ retracement is complete.
Elliott wave analysis is particularly good at identifying the places to watch for turns and entry/exit opportunities. With a Daily Analysis subscription, you get twice-daily updates for heavily traded markets including the Euro, gold, crude oil, bonds and the S&P 500. The Intraday Analysis subscription offers additional moment-by-moment coverage. Learn more at Trading On The Mark.
Twitter: @TradingOnMark
The authors may have a position in the mentioned securities at the time of publication. Any opinions expressed herein are solely those of the author, and do not in any way represent the views or opinions of any other person or entity.


