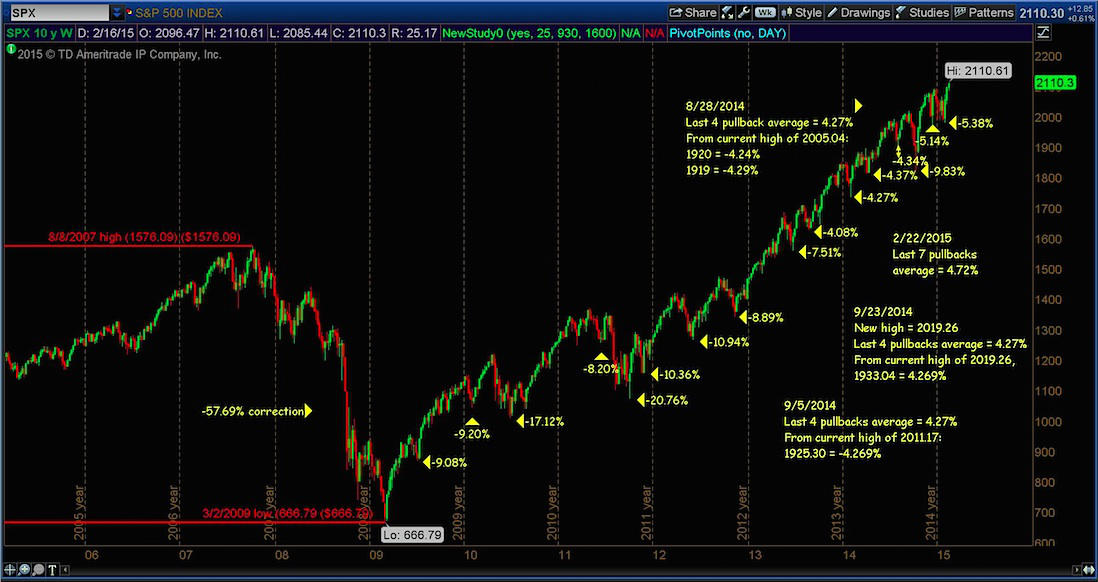
Over the past few months, the stock market has seen a few swings. This shouldn’t come as a big surprise. Back in August of 2014, I wrote a research note on the S&P 500 and the lack of a “technical correction.” In stock market lingo, a correction from current highs is generally considered to be -10%, while a pullback is generally less. At that time, the past 4 pullbacks averaged just over 4 percent.
Now that six months have passed, let’s check in to see if we got that S&P 500 correction and where the stock market is likely headed.
In September-October of 2014, we did indeed get a pullback of -9.83% (perhaps close enough). December of 2014 saw a pullback of -5.14%. And the only pullback so far in 2015 was -5.38%.
And for even more context, consider this: the average of the past seven pullbacks is -4.72%.
Those type of pullbacks will likely continue. However, given the Federal Reserves reluctance to raise interest rates, it’s my opinion the stock market still has more upside in 2015. And that could put off another S&P 500 correction for a little while.
S&P 500 Corrections and Pullbacks – 10 Year Weekly Chart
Thanks for reading.
Follow Dave on Twitter: @TheFibDoctor
No position in any of the mentioned securities at the time of publication. Any opinions expressed herein are solely those of the author, and do not in any way represent the views or opinions of any other person or entity.

: Worrisome to Broader Market?")


