S&P 500 LONGER TERM
The S&P 500 (INDEXSP:.INX) may be vulnerable to a pullback over the coming days/weeks, but that should produce another buying opportunity for active investors. I have a wide buy zone between 2490-2530 on any pullback.
Today I want to look out a bit further. Let’s discuss the weekly chart of the S&P 500 and highlight some price targets into 2018. What are time and price saying about stocks into next year?
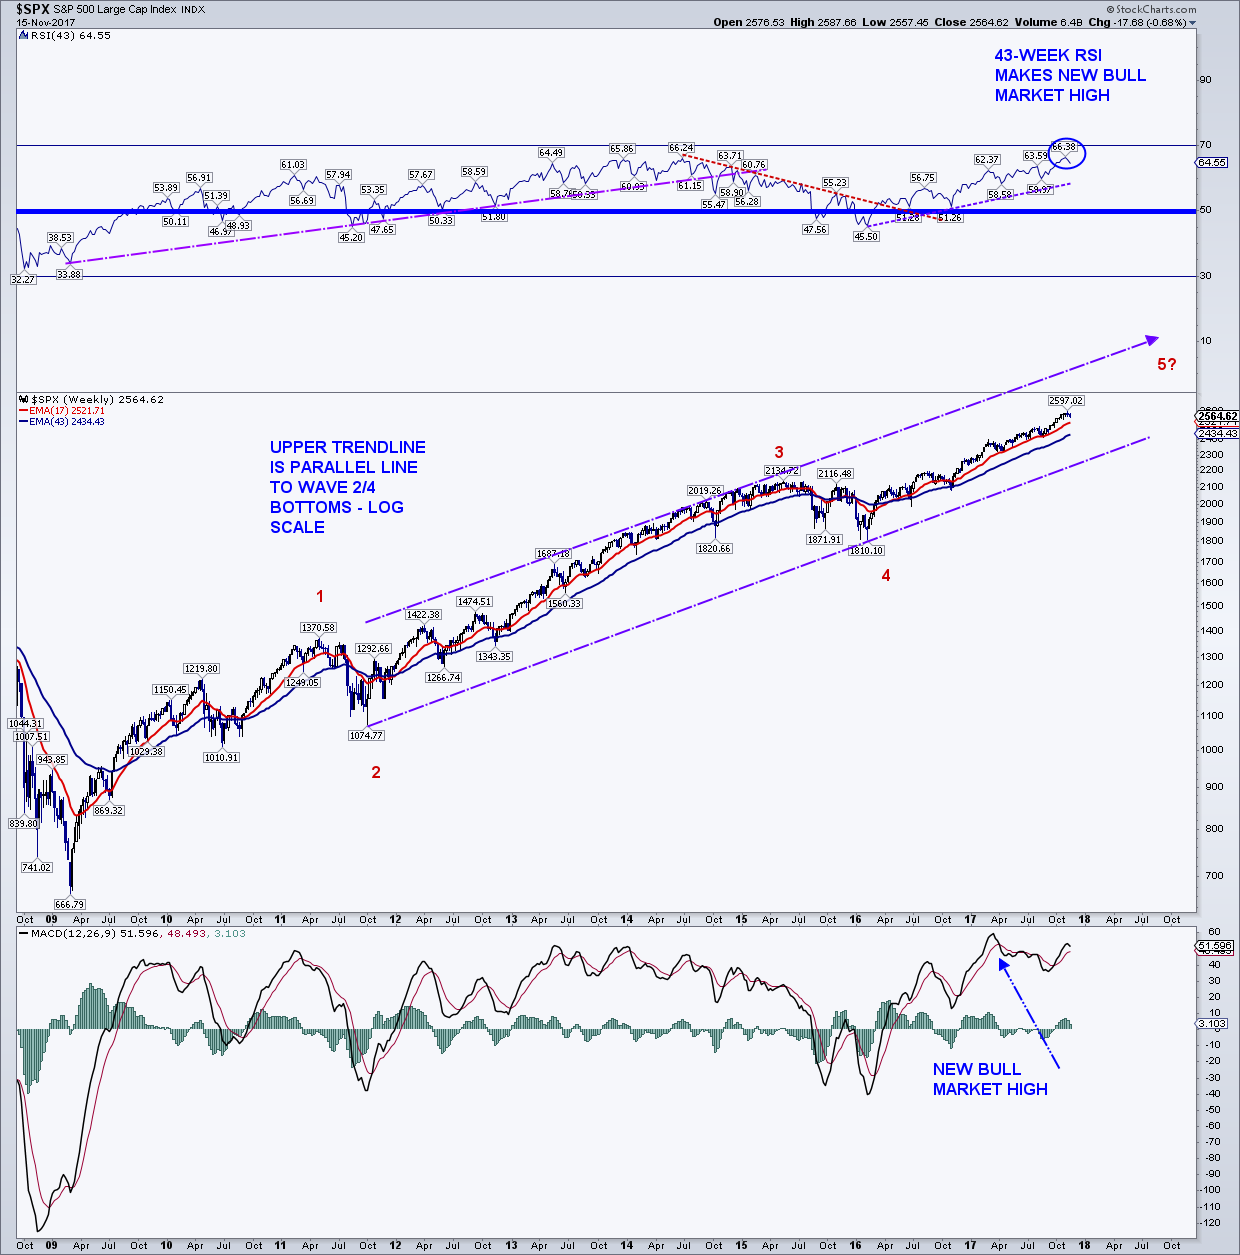
The weekly chart is still bullish, with both price and momentum (14W RSI) making new bull market highs. Generally, momentum on a longer-term chart (weekly, monthly) peaks well before price so the new high in the RSI suggests a major top is not in the cards in the immediate months ahead.
We are in the fifth and ending wave of the bull market. That said, many stocks suffered major bear markets in 2015/2016, so its possible that the bull is not quite as old as many say.
PRICE TARGETS: A 127% and 162% Fibonacci extension can be applied to the size of the bottom in 2016, giving us price targets of 2,547 to 2,660. We can also come up with price targets between 2,650 and 2,700 as Primary Elliott Wave 5 has surpassed Primary Wave 1. The first extension for Primary Wave 5 would be 123% of Primary Wave 1 giving us a target of 2,676.
S&P 500 Weekly Chart
Thanks for reading.
Twitter: @MarkArbeter
The author may have positions in related securities at the time of publication. Any opinions expressed herein are solely those of the author, and do not in any way represent the views or opinions of any other person or entity.


