Silver prices have bounced nicely, giving precious metals bulls something to cheer about. Finally (or so it seems).
The past year has been a long year with prices trending lower following the huge bull market rally that preceded the decline..
So, what’s next?
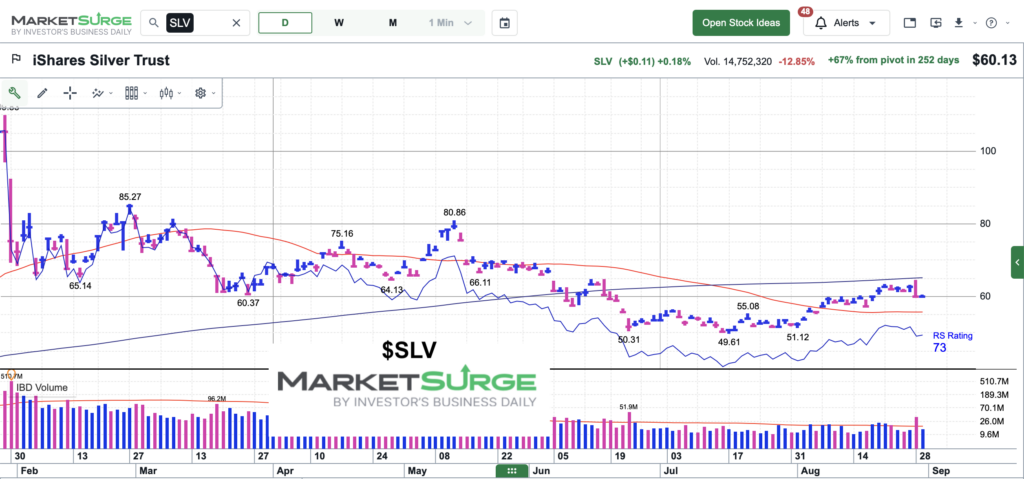
Well today we look at a daily chart of the Silver ETF (SLV) and highlight some price action that may give us a hint.
Note that the following MarketSurge charts are built with Investors Business Daily’s product suite.
I am an Investors Business Daily (IBD) partner and promote the use of their products. The entire platform offers a good mix of tools, education, and technical and fundamental data.
$SLV Silver Chart
On Friday, SLV printed a very bearish “engulfing” price candle. It literally engulfed the past 6 trading days and closed near the low. This likely says that the rally needs a “pause” and could be headed lower… at least before any continuation higher. Stay tuned.
Twitter: @andrewnyquist
The author may have a position in mentioned securities at the time of publication. Any opinions expressed herein are solely those of the author, and do not in any way represent the views or opinions of any other person or entity.