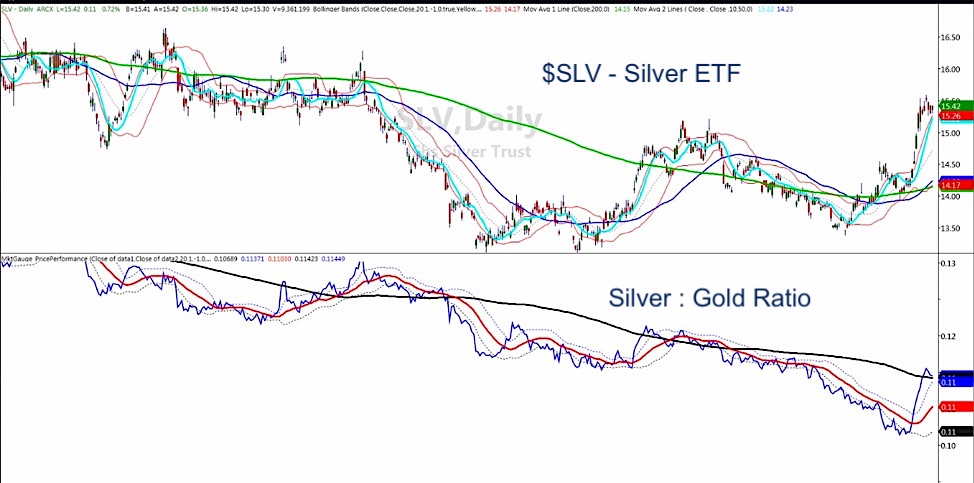
Here is an updated look at the Silver ETF – NYSEARCA: SLV – daily chart and the silver to gold ratio.
The initial breakout in the daily chart of silver happened when silver cleared the 200 daily moving average (green line top chart.)
At that point the price for the silver ETF or SLV, traded at 14.00.
The second breakout occurred over 14.50, which was a weekly exponential moving average not shown here.
The recent golden cross puts SLV in a bullish phase.
The recent price action indicates price consolidation.
The weekly chart’s next big area for this to clear is 15.40 or over the 200-week MA.
So, where does that leave the silver to gold ratio?
The bottom chart shows the ratio.
When I first began sharing this chart with you, silver was trading at a 90-year low to gold. But, I knew that would not last, hence, I began sharing the chart with you.
Then, when silver cleared the red line (a shorter-term MA), the price lined up perfectly with the breakout in SLV over 14.50.
The timing was perfect. Silver quickly moved (as you see in the Daily chart) from 14.55 up to 15.59 last week.
3 trading days later, SLV is consolidating.
But, before the spike to 15.59, the ratio chart cleared the second moving average or the black line. That is about a 4-month MA.
With the consolidation, we also see the price line retrace back perfectly to the black line or MA.
That is what we call a perfect retracement, or another buy opportunity.
As far as this week goes, we have a few factors to watch out for.
The Fed meeting first and foremost.
The dollar, which is super strong.
Any change in inflation metrics.
Technically, a move and hold in price above 15.40.
S&P 500 (SPY) Inside day. 302.23 the ATH. 300.00 pivotal. Under 299.60 some trouble.
Russell 2000 (IWM) Inside day. 158.03 has to clear 155.20 has to hold.
Dow (DIA) 273.99 all-time high. 270.50 must hold.
Nasdaq (QQQ) ATH at 195.55. 193.40 now the pivotal support.
KRE (Regional Banks) 56.75 next point of resistance with 54.62 key support
SMH (Semiconductors) ATH at 123.56. 120.71 now pivotal support. If breaks see 118.70 next.
IYT (Transportation) 195.28-192 the range we will watch to see which way it breaks.
IBB (Biotechnology) 105.42 the 50-DMA pivotal.
XRT (Retail) 43.12 is my number to clear.
Twitter: @marketminute
The author may have a position in the mentioned securities at the time of publication. Any opinions expressed herein are solely those of the author, and do not in any way represent the views or opinions of any other person or entity.


